ⓘ Educational Disclosure:
This article is for educational and informational purposes only. It does not constitute financial, legal, tax, or lending advice. SaveXpert and its authors are not licensed financial advisors. Loan rates, fees, and lender terms change frequently. Always verify current offers directly with lenders and consult a qualified financial professional before taking on debt.
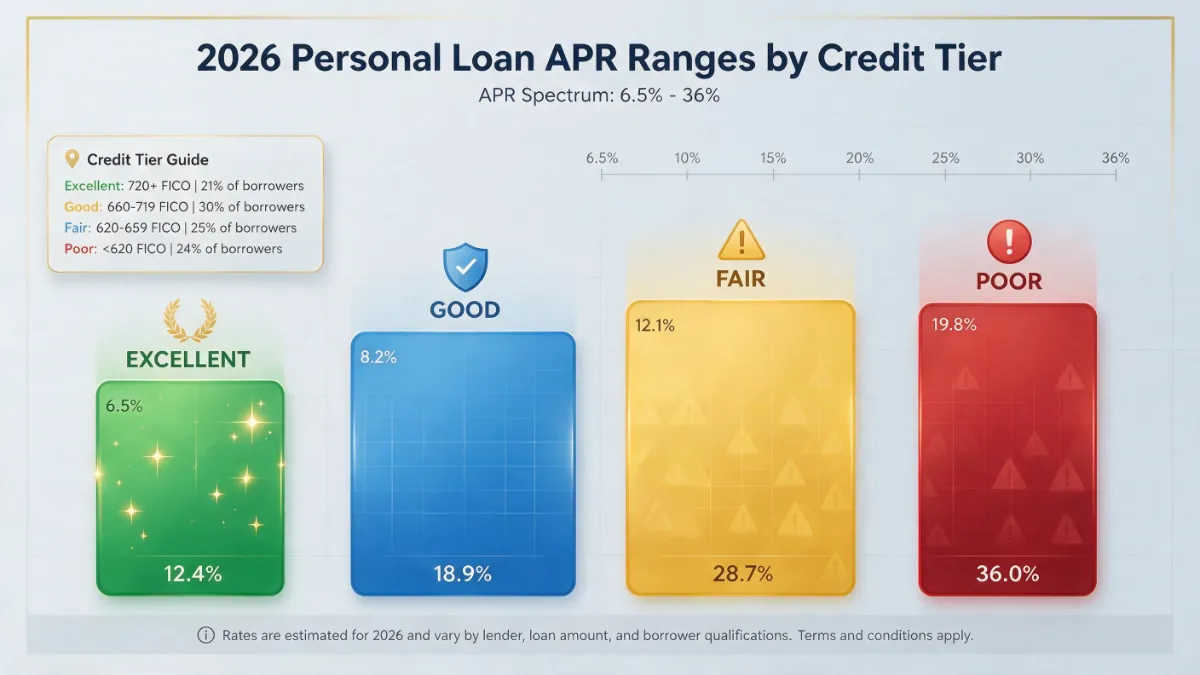
In 2026, personal loan APRs range from roughly 6.5% for borrowers with excellent credit to 36% for those with poor credit, with a national average of 12.3%–12.4% according to Federal Reserve G.19 consumer credit data. The advertised interest rate rarely reflects what a loan actually costs — origination fees of 1% to 8% are deducted before funds are disbursed, while the borrower repays interest on the full original principal. CFPB guidance is clear: APR — not the monthly payment — is the correct number to compare across competing loan offers.
What This Research Found
- National average APR: 12.3%–12.4% (Federal Reserve G.19, 2026). Excellent credit (740+) unlocks 6.5%–10%; poor credit pushes toward 22%–36%. The spread is nearly 30 percentage points.
- APR ≠ interest rate. APR includes mandatory origination fees; the nominal interest rate does not. A loan advertised at “8% interest” with a 5% origination fee may cost more in total than a “9% interest” no-fee loan. Always compare APRs.
- Origination fees reduce net proceeds. On a $10,000 loan with a 5% origination fee, the lender deposits $9,500 — but the borrower repays interest on the full $10,000 throughout the term.
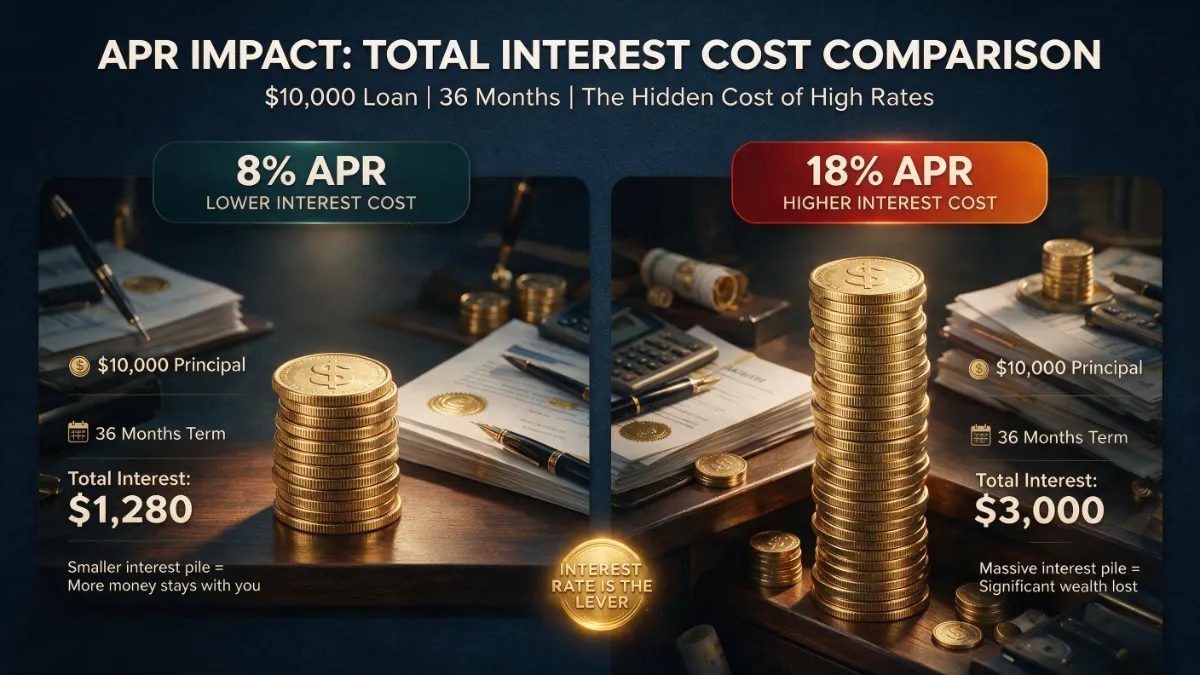
- A 10-point APR gap costs $1,733.76 over 36 months. On a $10,000 loan: 8% APR = $11,280.96 total repayment; 18% APR = $13,014.72. The monthly difference is $48.16 — which compounds to a meaningful total.
- Soft-pull pre-qualification has zero score impact. Collecting 3–5 pre-qualified offers from banks, credit unions, and online lenders before submitting one formal application is the CFPB-supported shopping strategy.
- Total repayment — not monthly payment — is the right number to evaluate. Longer terms lower monthly payments but almost always increase total interest paid. Monthly payment × number of months = actual loan cost.
- Time To Read: 7 Minutes
Table of Contents
1. 2026 Benchmark APRs by Credit Score Tier
2. APR vs. Interest Rate: How Origination Fees Change the Real Cost
3. Fixed vs. Variable Rate Personal Loans
4. How to Shop Rates Without Hurting Your Credit Score
5. The Total Cost of Borrowing: 8% vs. 18% APR Worked Example
6. How to Get the Lowest Personal Loan Rate in 2026
A personal loan can be a practical financial tool for debt consolidation, a large home repair, or a significant unexpected expense. But the advertised rate on the brochure and the actual cost of borrowing are often two very different things.
I went through Federal Reserve consumer lending benchmarks, CFPB guidance on lending disclosures, and current lender data to put this guide together. What the research shows is that the rate a borrower receives depends heavily on credit profile, income, debt-to-income ratio, and how lenders handle origination fees — none of which appear in the headline number.
2026 Benchmark APRs by Credit Score Tier
The nationwide average personal loan APR currently sits between 12.3% and 12.4% according to Federal Reserve G.19 Consumer Credit data. That single number blends prime and subprime lending into one average — which tells very little about what an individual borrower will actually receive.
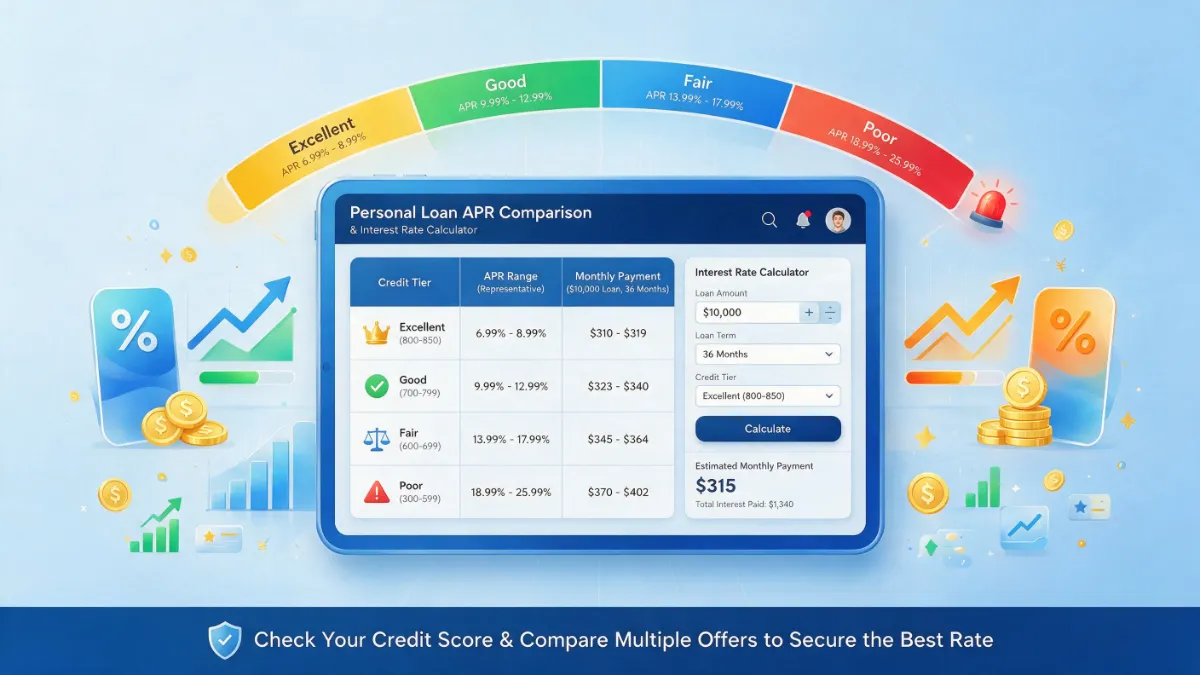
What the data clearly shows is that credit score tier is the single biggest driver of the rate offered. Here is what the spread looks like across tiers in 2026:
2026 Personal Loan APR Benchmarks by Credit Score Tier
| Credit Tier | Score Range | Expected APR Range (2026) | What This Typically Means |
|---|---|---|---|
| Excellent | 740–850 | 6.5% – 10.0% | Prime approval; lowest advertised rates available from most lenders |
| Good | 670–739 | 10.0% – 15.0% | Standard qualifying tier; rates near or above the national average |
| Fair | 580–669 | 15.0% – 22.0% | Elevated rates; stricter income and DTI verification typical |
| Poor | Below 580 | 22.0% – 36.0% | Subprime tier; rates approaching the 36% mainstream lending cap |
Source: Federal Reserve G.19 Consumer Credit Report, 2026; CFPB consumer lending data. Actual rates vary by lender, loan term, income verification, and DTI. These are benchmark ranges, not guaranteed offers.
What struck me when going through this data was the sheer size of the spread. The difference between excellent and poor credit isn’t a few percentage points — it’s potentially 30 points of APR on the same loan amount. On a $10,000 loan, that gap translates into thousands of dollars in extra interest over a standard repayment term.
📈 Federal Reserve G.19 — 2026 Consumer Credit Benchmarks
National average personal loan APR: 12.3%–12.4%
Credit card accounts assessed interest: 22.15% (Q2 2026 Federal Reserve data)
The spread between personal loan and credit card rates is a key reason personal loans are frequently used for credit card debt consolidation — when the borrower’s credit qualifies for a meaningfully lower APR.
It is also worth noting that qualifying for the best rates in the excellent tier typically requires more than just a high credit score. CFPB lending guidance confirms that lenders evaluate verified income stability and debt-to-income ratio alongside the credit score itself. A 780 score with high existing debt obligations may not receive the same offer as a 780 score with a clean income-to-debt picture.
APR vs. Interest Rate: How Origination Fees Change the Real Cost
The most important distinction I kept finding in CFPB disclosure materials was the difference between a nominal interest rate and APR. They are not the same number — and the gap between them is where borrowers most often get caught out.
Nominal Interest Rate: The base annual percentage charged on the unpaid principal balance. This determines how monthly interest accrues.
Annual Percentage Rate (APR): The total annual cost of borrowing — combining the interest rate with mandatory upfront charges like origination fees. Per the CFPB’s definition, APR is the standardized figure that allows honest comparison between competing loan offers.
A loan advertised at “8% interest” with a 5% origination fee can easily end up more expensive in total than a loan at “9% interest” with zero fees. APR accounts for both — the interest rate alone does not. Comparing two loan offers by their stated interest rate, without considering origination fees, produces a misleading cost comparison.
The Mathematical Impact of Origination Fees on Net Proceeds
Here is the specific mechanic that catches most borrowers off guard: origination fees are typically deducted from the loan before the money reaches the account. The borrower then pays interest on the full original principal — not the reduced net amount actually received.
Origination Fee Impact — $10,000 Loan with 5% Origination Fee
| Calculation Item | Amount |
|---|---|
| Requested loan principal | $10,000 |
| Origination fee deducted (5%) | − $500 |
| Net cash deposited into account | $9,500 |
| Total debt owed (principal + interest) | $10,000 + all accrued interest |
⚠️ What this means practically: If a borrower needs $10,000 in usable cash and the lender charges a 5% origination fee, requesting only $10,000 leaves them $500 short of the target. To walk away with the full $10,000 after the deduction, the borrower would need to request approximately $10,526 — and then pay interest on that higher amount throughout the entire term. The CFPB requires lenders to state origination fees in loan documents under Truth in Lending Act (TILA) regulations, but fees don’t always appear prominently in marketing materials. APR is the figure that fully accounts for this cost.
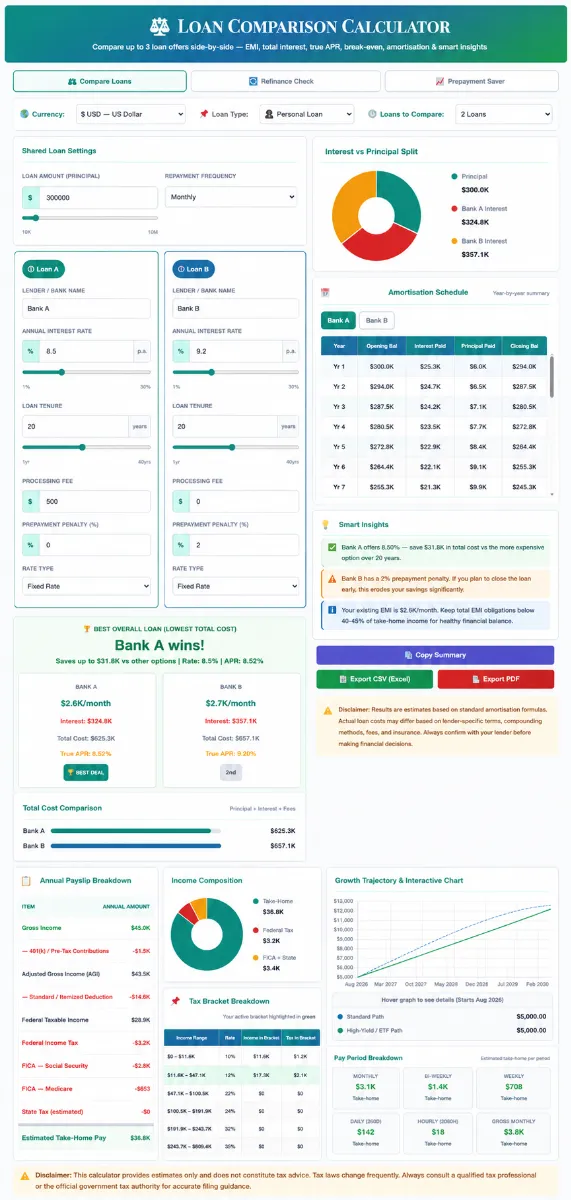
Compare two loans side-by-side to find the cheaper option.
Fixed vs. Variable Rate Personal Loans
Federal Reserve data on consumer lending shows that fixed-rate personal loans dominate the market for good reason — they offer payment predictability that variable-rate structures don’t. Here is what the research shows about each:
Fixed vs. Variable Rate Personal Loans — Key Differences
| Feature | Fixed-Rate Loan | Variable-Rate Loan |
|---|---|---|
| Monthly payments | Identical throughout the term | Rise or fall with benchmark index |
| Rate change risk | None — locked in at signing | High — fully exposed to market moves |
| Starting rate | May be slightly higher initially | Often lower introductory rate |
| Benefit if rates fall | None — requires refinancing to capture | Automatic rate and payment reduction |
| Budget planning | Easy — payment never changes | Difficult — payment can change monthly |
| Best suited for | Multi-year repayment (36–84 months) | Short-term loans with fast payoff (<12 months) |
The Federal Reserve’s historical consumer lending data consistently shows that in environments where benchmark rates are unpredictable, borrowers with multi-year repayment timelines have faced lower total costs with fixed-rate structures. Variable-rate products can make mathematical sense for borrowers planning an aggressive short payoff timeline — but that plan needs to be credible, not aspirational.
How to Shop Rates Without Hurting Your Credit Score
One of the most useful pieces of information I found in CFPB consumer credit guidance is that borrowers don’t have to choose a lender before seeing what rate they’d receive. Soft-pull pre-qualification allows lenders to generate estimated offers without any impact on the credit score.
Soft-Pull Pre-Qualification vs. Hard-Pull Formal Application
| Comparison Point | Soft-Pull Pre-Qualification | Hard-Pull Formal Application |
|---|---|---|
| Purpose | Estimate rates and terms before committing | Complete final underwriting — binding if approved |
| Credit score impact | 0 points | Typically fewer than 5 points (temporary) |
| Visible to other lenders? | No | Yes — visible on report for 24 months |
| Offer status | Estimated quote subject to full verification | Binding loan contract if borrower accepts |
The recommended approach based on what CFPB research supports:
1. Download credit reports first:
From AnnualCreditReport.com — check for errors before any lender sees the file. Correcting an inaccuracy before applying can shift which credit tier a borrower lands in.
2. Request soft-pull pre-qualifications from 3–5 lenders:
Banks, credit unions, and online platforms. Rate offers for the same borrower profile can vary by 3–5 percentage points or more across institution types.
3. Compare total APRs, origination fees, and net proceeds:
Across all offers. The offer with the lowest APR is not automatically the lowest total cost if origination fees differ significantly.
4. Select the lowest total cost option:
Calculated as monthly payment × number of months, not the lowest monthly payment in isolation.
5. Submit one formal application:
To the selected lender — this triggers the hard pull. One detail worth knowing from CFPB credit scoring guidance: multiple hard inquiries for the same loan type within a 14-to-45-day window count as a single inquiry event under major scoring models.
The Total Cost of Borrowing: 8% vs. 18% APR Worked Example
The number that matters most isn’t the monthly payment — it’s the total amount repaid over the full loan term. When I ran the numbers on a standard $10,000 loan over 36 months, here is what a 10-percentage-point APR difference actually costs:
The monthly payment for a fixed-rate amortizing loan is calculated by multiplying the principal by the monthly interest rate (APR divided by 12) and applying the standard amortization formula across the total number of payments. For a $10,000 loan at 8% APR over 36 months, the monthly rate is 0.667% and the payment works out to $313.36. At 18% APR, the monthly rate becomes 1.5% and the payment rises to $361.52.
Total Cost Comparison — $10,000 Loan Over 36 Months: 8% vs. 18% APR
| Loan Metric | Option A — 8% APR | Option B — 18% APR | Difference |
|---|---|---|---|
| Principal amount | $10,000 | $10,000 | $0 |
| Repayment term | 36 months | 36 months | — |
| Monthly payment | $313.36 | $361.52 | +$48.16/month |
| Total interest paid | $1,280.96 | $3,014.72 | +$1,733.76 |
| Total lifetime repayment | $11,280.96 | $13,014.72 | +$1,733.76 |
Calculations use standard fixed-rate loan amortization formula. Monthly rate = APR ÷ 12. Assumes no origination fees and no prepayment. For illustration purposes only — actual lender terms will vary.
The monthly payment difference looks manageable — $48.16 is easy to dismiss as a rounding error in a budget. But over 36 months, that adds up to $1,733.76 in additional interest charges for the exact same $10,000. This is precisely why the CFPB consistently emphasizes APR comparison over monthly payment comparison in its consumer lending education materials: the monthly payment is the figure lenders lead with, but total repayment is the figure that actually determines whether a loan was affordable.
📈 Try the SaveXpert Loan Comparison Calculator
The SaveXpert Loan Comparison Calculator lets you enter multiple loan offers — including different APRs, origination fees, and loan terms — and see the total cost difference immediately. Entering the actual numbers from pre-qualified offers produces a result specific to a real loan profile, not a national average.
Educational note: Calculator results are mathematical estimates based on user inputs. Actual lender repayment terms depend on official contract documents.
How to Get the Lowest Personal Loan Rate in 2026
Based on what CFPB borrower education research consistently shows, the steps that most reliably improve loan offers are preparation steps taken before any application goes in.
1. Audit credit reports for errors before applying.
Downloading credit files from AnnualCreditReport.com surfaces inaccurate collections, incorrect balances, or outdated derogatory entries worth disputing before a lender sees them. An FTC study cited by the CFPB found that one in five consumers has an error on at least one credit report. A corrected report can shift which credit tier a borrower lands in — and which rate tier a lender assigns.
2. Reduce revolving credit card utilization before applying.
CFPB credit scoring materials confirm that credit utilization — the percentage of available revolving credit in use — is one of the most immediately responsive scoring factors. Paying down card balances before applying can lower both the utilization ratio and the debt-to-income ratio that lenders calculate independently.
3. Collect pre-qualified quotes from multiple lender types.
Requesting soft-pull quotes from at least three different institutions establishes a baseline rate and reveals how much spread exists for the same borrower profile. The CFPB‘s research on lending disparities shows that rates can vary meaningfully across banks, credit unions, and online platforms for identical applicants.
4. Include credit unions in the comparison.
CFPB data shows credit unions — which are not-for-profit, member-owned institutions — frequently offer lower APRs and lower origination fees than commercial banks for personal loans. Federally chartered credit unions are subject to a regulatory personal loan rate cap of 18%, which provides meaningful rate protection for borrowers in the fair and poor credit tiers who may face much higher rates at commercial lenders.
5. Compare total cost — not monthly payment.
The finding that appeared most consistently in Federal Reserve and CFPB lending research was that borrowers who focus on monthly payment rather than total repayment cost consistently pay more over the life of a loan. A longer term reduces the monthly payment but almost always increases total interest paid. Monthly payment × number of months = what the loan actually costs.
6. Verify the loan agreement for hidden terms.
Confirming there are no prepayment penalties, optional credit insurance premiums added to the balance, or administrative fees not reflected in the advertised APR is part of a complete cost evaluation. Federal lending disclosure requirements under the Truth in Lending Act (TILA) require these to appear in loan documents — but they don’t always appear prominently in marketing materials.
The 4-Point Loan Evaluation Framework
There is no single universal personal loan rate in 2026. What the research consistently supports is evaluating any loan offer through four specific questions before accepting. The monthly payment is the figure lenders lead with — the questions below reveal what the loan actually costs.
1. What is the APR?
The true annualized borrowing cost including all mandatory fees — not just the stated interest rate. APR is the figure that makes honest comparisons between competing offers possible. Under TILA, lenders must disclose APR in loan documents.
2. What fees apply?
Origination fee percentage, late payment fees, any administrative charges, and — critically — whether a prepayment penalty applies. An otherwise attractive APR can be undermined by a prepayment penalty that eliminates the ability to reduce interest costs by paying early.
3. What is the net cash received?
Total requested principal minus origination fee equals money actually deposited. If a specific net cash target is needed, this calculation must inform the requested loan amount — not the other way around.
4. What is the total repayment amount?
Monthly payment multiplied by the total number of months equals the full loan cost. This figure — not the monthly payment — determines whether the loan is genuinely affordable across its entire term.
“The APR gap between excellent and poor credit in 2026 is nearly 30 percentage points. On a $10,000 loan, that gap translates to thousands of extra dollars in interest — which is why the preparation steps before an application matter as much as the application itself.”
— Kevin Brown, Lead Researcher at SaveXpert.com
Frequently Asked Questions
Ans: According to Federal Reserve G.19 consumer credit data, the national average personal loan APR in 2026 sits around 12.3%–12.4%. Any APR below that range is generally considered competitive. Borrowers with excellent credit profiles (740+) frequently qualify for rates between 6.5% and 10% APR from prime lenders. The key comparison metric is APR — not the nominal interest rate — because APR includes origination fees and other mandatory charges that the stated rate does not.
Ans: Origination fees — typically 1% to 8% of the loan principal — are subtracted from the loan amount before funds are deposited. On a $10,000 loan with a 5% ($500) origination fee, the lender deposits $9,500 in net cash while the borrower repays interest on the full $10,000 principal throughout the term. The CFPB requires lenders to disclose origination fees in loan documents under Truth in Lending Act regulations. If a specific net cash target is needed, the requested principal must be calculated to account for this deduction.
Ans: No. Pre-qualification uses a soft credit inquiry, which allows lenders to review a credit file summary without any scoring impact. A hard inquiry — which can temporarily reduce a FICO Score by fewer than five points — only occurs when a borrower formally submits a completed loan application. Using soft-pull pre-qualification from multiple lenders before committing to one formal application is the CFPB-supported approach to rate comparison shopping.
Ans: Most reputable personal loan lenders in 2026 do not charge prepayment penalties, meaning extra principal payments or full early payoff reduce total interest without additional fees. The loan agreement is the definitive source — CFPB guidance recommends verifying prepayment terms in the official loan disclosure before signing. Confirming the absence of a prepayment penalty is one of the four evaluation questions in the framework above — and one that directly determines whether paying down the loan faster actually saves money.
Ans: Lenders use proprietary underwriting models that weight credit factors differently, and they carry different funding costs and risk appetites across institution types. Federal Reserve lending research shows that for identical applicants, rates can vary by 3 to 5 percentage points or more between commercial banks, credit unions, and online lending platforms. Federally chartered credit unions are subject to a regulatory rate cap of 18% on personal loans — providing meaningful pricing protection at the subprime end of the market compared to commercial lender rates that can reach 36%.
Ans: It depends on the credit card APR versus the personal loan APR available to that specific borrower. According to Federal Reserve Q2 2026 data, the average credit card APR on interest-assessed accounts is 22.15%. A personal loan for a borrower with good credit may offer 10%–15% APR — generating meaningful interest savings on a fixed payoff timeline. A key structural advantage of personal loans for consolidation is the defined repayment term, which creates a fixed payoff date that revolving credit cards don’t provide. CFPB consumer lending guidance recommends comparing total repayment cost — not just monthly payment — when evaluating debt consolidation options.