

ⓘ Educational Disclosure:
This article is for educational and informational purposes only. It does not constitute financial, legal, tax, lending, or investment advice. SaveXpert and its authors are not licensed financial advisors, CPAs, attorneys, or tax advisors. All data comes from publicly available government and institutional sources. The 2027 tax bracket figures in this article are projections based on statutory formulas and published inflation data — the IRS has not yet released official 2027 brackets as of September 24, 2026. Always verify final figures against the official IRS Revenue Procedure when published and consult a qualified tax professional before making tax-related decisions. Always consult a qualified professional before making investment decisions.
What are the projected 2027 tax brackets? The IRS has not released official 2027 figures as of September 24, 2026. Projections based on the statutory formula in 26 U.S.C. §1(f) and BLS CPI data through August 2026 indicate a roughly 3.2% upward inflation adjustment to income thresholds. The seven federal tax rates remain unchanged at 10%, 12%, 22%, 24%, 32%, 35%, and 37%. The projected top 37% threshold is $661,375 for single filers and $793,650 for married couples filing jointly. The standard deduction is projected to rise to $16,600 for single filers and $33,200 for joint filers, up from the official 2026 amounts of $16,100 and $32,200. The IRS is expected to publish the official Revenue Procedure between mid-October and November 2026 — treat any current figures as working projections until that release.
Key Takeaways
- Problem: Taxpayers planning for 2027 need the inflation-adjusted income thresholds, but the IRS hasn’t published the official figures yet. As of September 24, 2026, every available “2027 bracket” figure — including Thomson Reuters Checkpoint’s widely cited numbers — is a projection, not an official IRS schedule.
- Solution: Projections based on the statutory inflation formula in 26 U.S.C. §1(f) and BLS CPI data through August 2026 point to a roughly 3.2% upward adjustment. The seven federal tax rates stay unchanged at 10%, 12%, 22%, 24%, 32%, 35%, and 37%. Only the income thresholds move. The projected standard deduction rises to $16,600 for single filers and $33,200 for married couples filing jointly.
- Result: The 3.2% adjustment is incremental — larger than the 2.7% move from 2025 to 2026 but not a dramatic rewrite. The IRS is expected to publish the official Revenue Procedure between mid-October and November 2026. All projected figures should be treated as planning references until that release.
- Source: 26 U.S.C. §1(f) · IRS Revenue Procedure 2025-32 · BLS CPI Data
- Time To Read: 9 Minutes
Table of Contents
1. Why the 2027 Tax Brackets Still Aren’t Official
2. What the Projected 2027 Tax Brackets Show
3. When Does the IRS Announce the New Tax Brackets?
4. What Is the Projected Standard Deduction for 2027?
5. How Inflation Adjustments Actually Affect Your Taxes
6. Which Tax Bracket Are You In for 2027?
8. What Americans Can Realistically Expect
9. Bottom Line: 5 Steps to Use the 2027 Projections Correctly
The IRS hasn’t published the official 2027 tax brackets yet. As of September 24, 2026, every “2027 bracket” figure in circulation — including the widely cited Thomson Reuters Checkpoint projections, which Thomson Reuters explicitly labels as estimates — comes from statutory inflation formulas and BLS CPI data through August 2026. The projected adjustment is roughly 3.2%. The seven federal tax rates stay at 10%, 12%, 22%, 24%, 32%, 35%, and 37%. What moves are the income thresholds — and understanding exactly how and why they move is the purpose of this article.
I went through the published IRS material, the statutory references, and the inflation-based projections in the research brief. The sources point to the same core framework: federal tax brackets adjust under a statutory formula tied to inflation data, not from scratch each year. Here’s what that framework actually shows for 2027.
Why the 2027 Tax Brackets Still Aren’t Official
The statutory formula in 26 U.S.C. §1(f) drives this timing. Federal tax bracket thresholds adjust using the Chained CPI-U, averaged over the 12 months ending August 31 of the preceding calendar year. For 2027 brackets, that means the IRS needs CPI data through August 2026.
The Bureau of Labor Statistics released August 2026 CPI data on September 11, 2026. That data release is what makes the statutory calculation possible. After BLS releases that data, the IRS completes the calculation and publishes it in a Revenue Procedure — a process that typically runs mid-October through November.
| Step | What Happens | Date / Status |
|---|---|---|
| BLS releases August CPI data | Provides the inflation input for the statutory calculation | September 11, 2026 ✅ Complete |
| Statutory calculation runs | IRS applies 26 U.S.C. §1(f) Chained CPI-U formula to produce inflation-adjusted thresholds | Underway as of September 2026 |
| IRS publishes Revenue Procedure | Official 2027 brackets, standard deductions, and related inflation adjustments become final | Expected mid-October to November 2026 |
| Projections available now | Thomson Reuters Checkpoint, Bloomberg Tax, and Tax Foundation have published estimates based on the same statutory formula — explicitly labeled as projections, not IRS figures | September 2026 — available but not official |
Source: 26 U.S.C. §1(f) · BLS CPI · Thomson Reuters Checkpoint (private — explicitly labels 2027 figures as estimates)
Thomson Reuters Checkpoint is worth naming specifically here because its 2027 figures circulate widely in tax coverage. Thomson Reuters itself states that the IRS will publish official figures later in 2026 — its own numbers are projections based on the same statutory formula. That’s the right framing for every 2027 bracket figure available before the Revenue Procedure lands.

What the Projected 2027 Tax Brackets Show
The research brief projects a roughly 3.2% upward adjustment from 2026 to 2027. The seven federal tax rates — established in 26 U.S.C. §1(j) — stay at 10%, 12%, 22%, 24%, 32%, 35%, and 37%. Only the income thresholds change.
Projected 2027 brackets — married filing jointly
| Tax Rate | Projected 2027 Taxable Income Range (MFJ) | Official 2026 Range (MFJ) |
|---|---|---|
| 10% | $0 – $25,600 | $0 – $24,850 |
| 12% | $25,601 – $104,050 | $24,851 – $100,950 |
| 22% | $104,051 – $218,250 | $100,951 – $211,450 |
| 24% | $218,251 – $416,650 | $211,451 – $403,850 |
| 32% | $416,651 – $529,100 | $403,851 – $512,400 |
| 35% | $529,101 – $793,650 | $512,401 – $768,700 |
| 37% | Over $793,650 | Over $768,700 |
⚠️ Projected figures only — not official IRS figures. Official 2026 figures from IRS Revenue Procedure 2025-32. 2027 projections based on ~3.2% Chained CPI-U adjustment per 26 U.S.C. §1(f).
Projected 2027 brackets — single filers
| Tax Rate | Projected 2027 Taxable Income Range (Single) | Official 2026 Range (Single) |
|---|---|---|
| 10% | $0 – $12,800 | $0 – $12,425 |
| 12% | $12,801 – $52,025 | $12,426 – $50,475 |
| 22% | $52,025 – $109,125 ⚠️ | $50,476 – $105,725 |
| 24% | $109,125 – $208,325 | $105,726 – $202,000 |
| 32% | $208,325 – $264,550 | $202,001 – $256,200 |
| 35% | $264,551 – $661,375 | $256,201 – $640,600 |
| 37% | Over $661,375 | Over $640,600 |
⚠️ Projected figures only. Official 2026 figures from IRS Revenue Procedure 2025-32 and the IRS 2026 inflation adjustments announcement.
⚠️ Single-filer 22% threshold — verify when the Revenue Procedure publishes: The research brief reproduces the single-filer 22% bracket lower threshold as $52,025, which is the same figure as the 12% bracket upper endpoint. In a standard bracket schedule, adjacent brackets don’t share the same dollar boundary — the 12% bracket typically ends at one figure and the 22% bracket begins at the next dollar above it. This appears to be a rounding presentation in the projection source rather than an error in the underlying calculation. Confirm the exact boundary figure against the official IRS Revenue Procedure when it is published between mid-October and November 2026.
The 2026 official figures are the clearest reference point for the size of the move. IRS Revenue Procedure 2025-32 puts the 2026 top 37% threshold at $640,600 for single filers and $768,700 for married couples filing jointly. The projected 2027 figures of $661,375 and $793,650 represent approximately $20,775 and $24,950 in upward threshold movement for the top bracket alone — consistent with the 3.2% projection across all brackets.
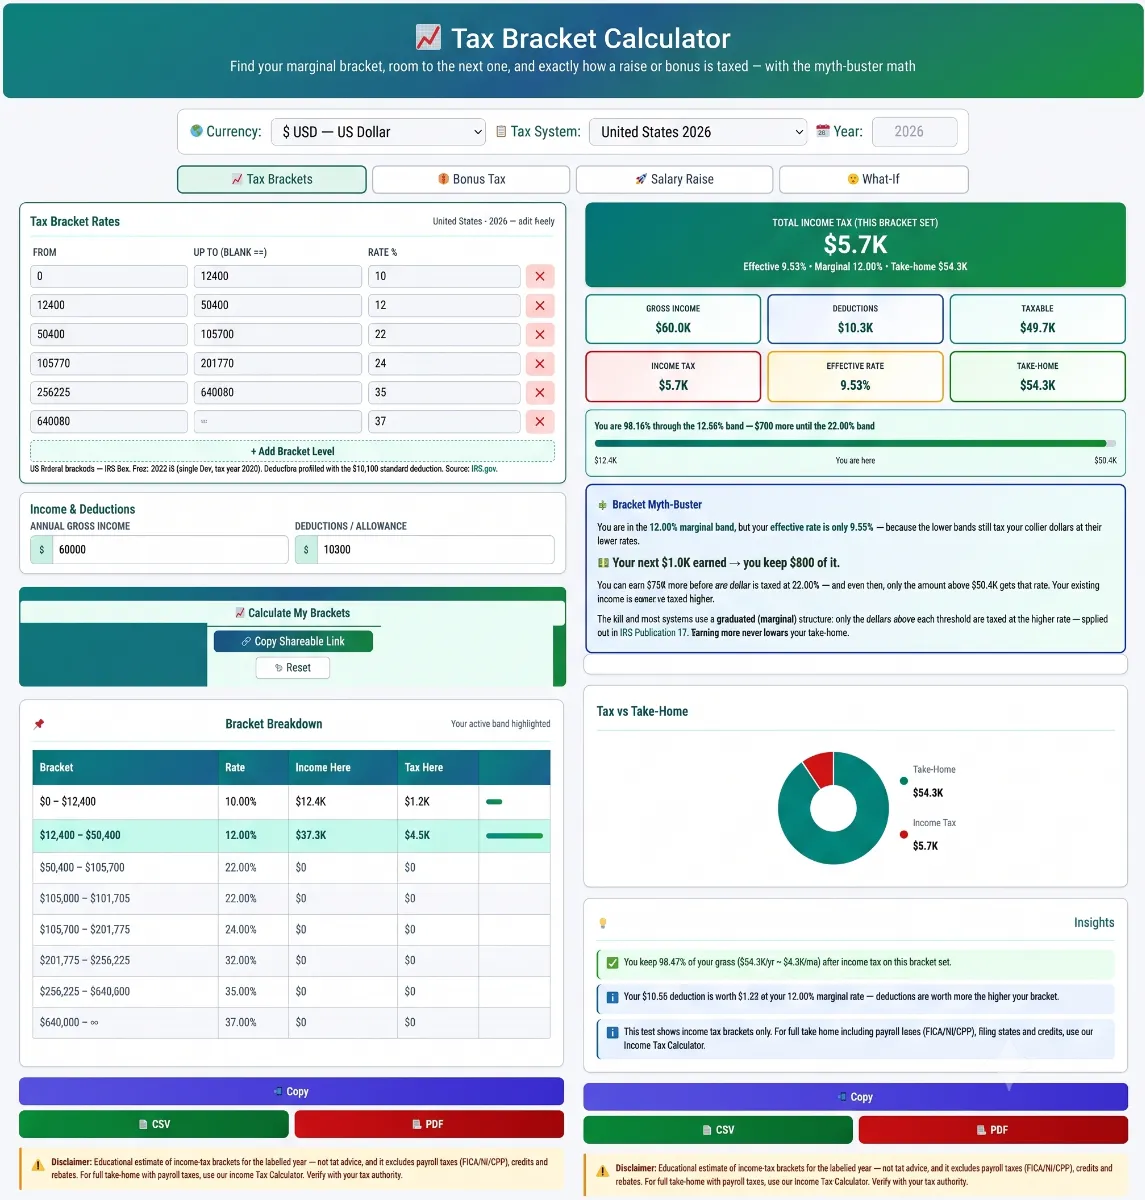
Find your marginal bracket, income tax, and take-home.
When Does the IRS Announce the New Tax Brackets?
The IRS publishes inflation-adjusted figures in a Revenue Procedure after the August CPI data becomes available. The pattern is consistent from year to year.
| Tax Year | Revenue Procedure | Publication Date |
|---|---|---|
| 2026 brackets | IRS Revenue Procedure 2025-32 | October 9, 2025 |
| 2027 brackets | Revenue Procedure — not yet published | Expected mid-October to November 2026 |
Source: IRS Revenue Procedure 2025-32 · BLS August 2026 CPI release date: September 11, 2026
Bloomberg Tax’s projection — reported through The Hill — puts the 2027 adjustment at 3.2%, up from the 2.7% adjustment applied from 2025 to 2026. That comparison is a useful way to calibrate expectations: 2027 gets a somewhat larger adjustment than 2026 got, reflecting slightly higher inflation in the relevant measurement period. Neither number is dramatic. Both produce incremental threshold increases rather than bracket restructuring.
Until the Revenue Procedure is published, any number labeled “2027 tax bracket” is a projection. That applies to this article’s figures, Thomson Reuters Checkpoint’s estimates, Tax Foundation’s analysis, and every piece of media coverage citing those sources. The official IRS Revenue Procedure is the document that settles the question.

What Is the Projected Standard Deduction for 2027?
The standard deduction uses a different statutory provision than the tax brackets — 26 U.S.C. §63(c)(7) — and a different base year. While the tax brackets trace back to 2016 and 2017 base years under the statutory formula, the standard deduction calculation uses 2024 as its base year. Those different starting points can produce different adjustment rates for brackets vs. standard deductions in any given year.
| Filing Status | Official 2026 Standard Deduction | Projected 2027 Standard Deduction | Projected Change |
|---|---|---|---|
| Single | $16,100 | $16,600 | +$500 |
| Married Filing Jointly | $32,200 | $33,200 | +$1,000 |
| Head of Household | $24,100 (2026 official) | $24,900–$24,950 (projected — ⚠️ flagged for verification) | +$800–$850 |
⚠️ All 2027 figures are projections — not official. 2026 official figures from the IRS 2026 inflation adjustments announcement. Head of Household 2027 projection flagged in research brief for verification. Statutory basis: 26 U.S.C. §63(c)(7).
The standard deduction connection to itemisation rates matters for planning. The research brief notes that the higher standard deduction levels from 2026 onward correlate with lower itemisation rates — fewer taxpayers find that their itemised deductions exceed the standard deduction amount. A projected $16,600 standard deduction for single filers in 2027 raises the threshold at which itemising produces a better outcome. For most taxpayers, particularly those without large mortgage interest, state/local tax deductions up to the SALT cap, or significant charitable contributions, the standard deduction continues to be the higher-value choice.
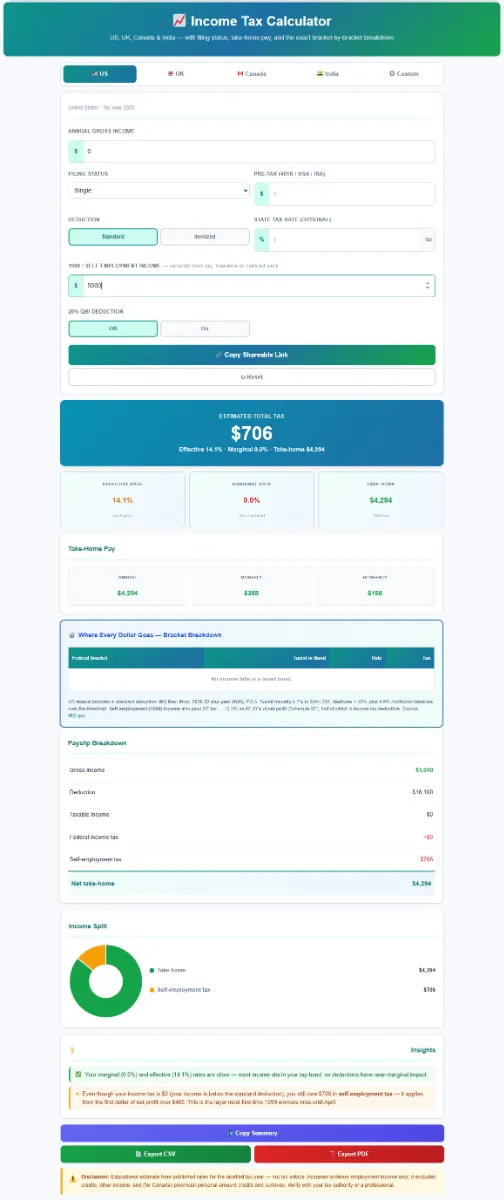
Estimate your tax, effective rate, and take-home pay.
How Inflation Adjustments Actually Affect Your Taxes
The adjustment changes the income thresholds. It doesn’t change the seven rates. That’s the most important distinction in the entire 2027 bracket story — and it’s the one that gets most frequently lost in headline coverage.
What bracket creep is and why the adjustment exists
Bracket creep happens when nominal wages rise with inflation while real purchasing power stays roughly the same. Without an annual adjustment, a taxpayer whose salary increases 3% — matching inflation exactly — ends up in a higher bracket on paper even though their real buying power hasn’t improved. The statutory formula in 26 U.S.C. §1(f) exists specifically to prevent that outcome by shifting the thresholds upward each year in line with inflation.
What the One Big Beautiful Bill Act changed
The One Big Beautiful Bill Act (OBBBA) made several changes relevant to the 2027 bracket picture:
| OBBBA Change | What It Means | Source |
|---|---|---|
| Permanently preserved seven TCJA ordinary income tax rates | The 10%, 12%, 22%, 24%, 32%, 35%, 37% rate structure — originally set to expire — is now permanent law; no sunset risk for the rate schedule itself | 26 U.S.C. §1(j) |
| Additional inflation adjustment for 10% and 12% brackets from 2026 | The OBBBA added a targeted extra adjustment for income in the two lowest brackets beginning in 2026; this uses different base years than the higher brackets | Tax Foundation analysis (private) · 26 U.S.C. §1 |
| Different base years for lower vs. higher brackets | Lower brackets (10%, 12%) use a different base year under the post-OBBBA structure than the 22%+ brackets; this is why the 10%/12% thresholds may shift at a slightly different rate than the higher brackets | 26 U.S.C. §1(f) |
| $6,000 senior deduction for eligible taxpayers 65+ during 2025–2028 | Available for eligible taxpayers age 65 and older; subject to phaseouts; applies during tax years 2025 through 2028 | IRS 2026 OBBBA announcement |
Source: 26 U.S.C. §1 · IRS 2026 OBBBA adjustments announcement · Tax Foundation coverage (private analysis)
Marginal rate vs. effective tax rate — the distinction that matters
Your marginal tax rate is the rate that applies to the last dollar of taxable income — the bracket where your income tops out. Your effective tax rate is total federal income tax divided by total taxable income. These two numbers are rarely the same, and the effective rate is typically the more useful figure for understanding overall tax burden.
A single filer with $80,000 in taxable income in 2027 doesn’t pay 22% on all $80,000. They pay 10% on the first $12,800, 12% on income from $12,801 to $52,025, and 22% only on income above that — the slice that falls in the 22% bracket. The effective rate on $80,000 works out to well below 22%. Most income falls in lower brackets even for taxpayers who reach a higher marginal rate. The research brief makes this distinction explicitly, and it’s the reason that focusing only on your top bracket can be misleading.
Which Tax Bracket Are You In for 2027?
Two inputs determine your bracket: your filing status and your taxable income. Taxable income is gross income minus above-the-line deductions minus either the standard deduction or itemised deductions. It’s a lower number than your gross income or even your adjusted gross income — which is why a taxpayer who earns $70,000 doesn’t necessarily end up in the 22% bracket on all of it.
I’d use the projected 2027 figures as a working estimate rather than a final IRS answer. The projected thresholds are based on the same statutory formula the IRS uses — they’re not guesswork. But until the Revenue Procedure is published, they carry a small margin of uncertainty in the precise threshold amounts. For planning, the projected figures are useful. For anything that requires exact numbers — withholding calculations, quarterly estimated tax payments, finalised Roth conversion strategies — wait for the official IRS release.
🧮 SaveXpert Tax Calculators — Free & No Signup
The Tax Bracket Calculator takes your filing status and estimated taxable income and shows both your marginal bracket and your effective tax rate using the projected 2027 thresholds. The Income Tax Calculator estimates total federal tax liability — factoring in the projected standard deduction and applicable credits — to give a fuller picture of your 2027 tax position before the official IRS figures arrive.
Educational note: Calculators use projected figures. Verify final brackets against the official IRS Revenue Procedure when published. Source: 26 U.S.C. §1(f) · IRS Federal Income Tax Rates
What the Research Shows Works
Understand the adjustment before reacting to the headline number.
A 3.2% inflation adjustment to income thresholds means a taxpayer whose taxable income also grows by roughly 3.2% stays in essentially the same bracket position relative to the thresholds. The adjustment prevents bracket creep — it doesn’t create a tax cut or a tax increase for most taxpayers. The rates haven’t changed. Only where each rate begins has moved.
Marginal rate vs. effective rate tells the more useful story.
The research brief is direct on this: your effective tax rate — total tax divided by total taxable income — reflects your actual overall burden better than your marginal bracket placement alone. Most income falls in lower brackets even for taxpayers who reach a higher marginal rate. Knowing you’re in the 22% bracket tells you what rate applies to your last dollar of taxable income, not what you pay on all of it.
The standard deduction increase matters more for planning than the threshold shifts for most taxpayers.
The projected $500 increase for single filers ($16,100 → $16,600) and $1,000 increase for joint filers ($32,200 → $33,200) directly reduce taxable income for the roughly 90% of taxpayers who take the standard deduction. That’s a concrete reduction in the income subject to tax — more immediately relevant for most households than tracking which bracket threshold moved by exactly how much.
The One Big Beautiful Bill Act’s permanent rate preservation removes a planning uncertainty.
The seven TCJA rates were scheduled to expire. They no longer are. Planning assumptions built on 10%, 12%, 22%, 24%, 32%, 35%, and 37% as the permanent ordinary income rate structure are now on stable statutory footing. The research brief notes this explicitly, and it’s a meaningful change from a planning standpoint — the sunset risk that previously complicated multi-year tax strategies is gone.
Large income-timing strategies based only on bracket threshold movements aren’t supported by the research.
The marginal rate changes at bracket boundaries from one year to the next — around 3.2% in threshold terms — are too small to justify significant income-deferral or acceleration strategies for most taxpayers on their own. The research brief makes this point clearly. If a Roth conversion, asset sale, or income acceleration decision makes sense, it should be based on the overall rate structure and the taxpayer’s multi-year income picture — not on a $500–$1,000 movement in a bracket boundary.

What Americans Can Realistically Expect
The available data points to incremental changes — not a rewrite of the federal tax system.
| What to Expect | The Research Finding | Source |
|---|---|---|
| Inflation adjustment size | ~3.2% (vs. 2.7% adjustment from 2025 to 2026) | Bloomberg Tax projection via The Hill (private) · consistent with BLS CPI data |
| Federal tax rates | Unchanged at 10%, 12%, 22%, 24%, 32%, 35%, 37% — permanently preserved by the OBBBA | 26 U.S.C. §1(j) |
| Official IRS publication timing | Mid-October to November 2026; the 2026 Revenue Procedure published October 9, 2025 as a pattern reference | IRS Rev. Proc. 2025-32 |
| Standard deduction direction | Projected upward — $16,600 single / $33,200 MFJ — but not official until the Revenue Procedure | Statutory projection per 26 U.S.C. §63(c)(7) |
| $6,000 senior deduction (65+, 2025–2028) | Available during this period, subject to phaseouts; not a bracket change but a separate deduction provision from the OBBBA | IRS OBBBA announcement |
Source: Official sources as linked. Bloomberg Tax projection is private analysis — not an IRS figure.
The most realistic framing for 2027: the projected thresholds and standard deduction give a useful working reference while you wait for the Revenue Procedure. Plan with the projections, but don’t finalise any withholding adjustments, quarterly estimated payments, or detailed tax strategies until the official IRS figures replace the estimates. The Revenue Procedure’s expected timing — mid-October to November 2026 — gives you the official numbers well before the 2027 tax year begins January 1, 2027.
Bottom Line: 5 Steps to Use the 2027 Projections Correctly
1. Keep “projected” and “official” as separate categories until the Revenue Procedure publishes:
Thomson Reuters Checkpoint — the most widely cited source for 2027 bracket projections — explicitly labels its figures as estimates. Every 2027 bracket figure you see before the IRS publishes its Revenue Procedure (expected mid-October to November 2026) falls in the same category: a projection based on the statutory formula, not a final IRS number. Use the projections for planning. Replace them with official figures when the Revenue Procedure lands. Book it on your calendar now — the 2026 equivalent published October 9, 2025.
2. Remember: the seven rates aren’t changing — only the income thresholds move:
The most common misread of an inflation adjustment story is treating a threshold change as a rate change. The rates — 10%, 12%, 22%, 24%, 32%, 35%, 37% — are permanently established by 26 U.S.C. §1(j) and reinforced by the One Big Beautiful Bill Act. A 3.2% adjustment moves the income levels where each rate begins. It doesn’t lower or raise any rate. A taxpayer in the 22% bracket in 2026 who gets a 3.2% raise and faces a 3.2% threshold adjustment ends up in essentially the same bracket position — that’s exactly what the adjustment is designed to produce.
3. Run the Tax Bracket Calculator with your estimated 2027 taxable income — not your gross income:
Taxable income is the relevant input, not your salary or gross income. Subtract above-the-line deductions, then subtract the projected $16,600 standard deduction (single) or $33,200 (MFJ) — or your itemised deductions if they’re higher. The number that remains is what gets compared to the bracket thresholds. The Tax Bracket Calculator handles that comparison and shows both your marginal bracket and your effective tax rate — which is the more useful measure of overall burden.
4. Check the projected standard deduction against your itemised deduction estimate before the year starts:
The projected $16,600 single / $33,200 MFJ standard deduction for 2027 is the threshold where itemising becomes worth the effort. If your total itemised deductions — mortgage interest, charitable contributions, state and local taxes up to the SALT cap — fall below the standard deduction, taking the standard deduction produces the lower taxable income. The increase from 2026 to 2027 ($500 single / $1,000 MFJ) means a few more taxpayers will find their itemised deductions fall under the new threshold. Run this comparison with your expected 2027 deductions before the year begins.
5. If you’re 65+ or planning around retirement contributions, check the OBBBA-specific provisions separately:
The $6,000 senior deduction for eligible taxpayers age 65 and older applies during 2025–2028, subject to phaseouts — verify current eligibility thresholds in the official IRS OBBBA adjustments announcement. For those planning IRA contributions around the 2027 limits, the IRA Catch-Up Contributions 2027 article on SaveXpert covers the SECURE 2.0 catch-up figures separately — because IRA contribution limits follow a different inflation-adjustment schedule than income tax brackets.
“The part of the 2027 bracket story that most people miss is the base-year structure. The seven tax rates haven’t moved — they stay at 10%, 12%, 22%, 24%, 32%, 35%, and 37%. But the formula that shifts income thresholds upward doesn’t use a single starting point. Tax brackets use 2016 and 2017 base years under the statutory formula. The standard deduction calculation uses 2024 as its base year under a separate statutory provision. The One Big Beautiful Bill Act added another layer — an additional inflation adjustment specifically for the 10% and 12% brackets from 2026 onward. That’s three different adjustment mechanisms running simultaneously. The 3.2% headline figure is the combined output of all three — not a single lever someone pulled.”
— Kevin Brown, Lead Researcher at SaveXpert.com
Frequently Asked Questions
Ans: The official 2027 tax brackets have not been released by the IRS as of September 24, 2026. Projections based on 26 U.S.C. §1(f) and BLS CPI data through August 2026 indicate a roughly 3.2% upward adjustment to income thresholds. The seven federal rates — 10%, 12%, 22%, 24%, 32%, 35%, and 37% — remain unchanged. The projected top 37% threshold is $661,375 for single filers and $793,650 for married couples filing jointly. The IRS is expected to publish official figures in a Revenue Procedure between mid-October and November 2026.
Ans: The IRS publishes annual inflation adjustments in a Revenue Procedure after the BLS releases August CPI data. The BLS released August 2026 data on September 11, 2026. Based on the prior-year pattern — IRS Revenue Procedure 2025-32 published on October 9, 2025 — the 2027 official figures are expected between mid-October and November 2026. Any 2027 bracket figures published before the Revenue Procedure are projections, not official IRS figures.
Ans: The official 2027 standard deduction has not been announced. Projections under 26 U.S.C. §63(c)(7) — which uses 2024 as the base year, separate from the base years used for tax brackets — point to $16,600 for single filers and $33,200 for married couples filing jointly. Those figures compare with the official 2026 amounts of $16,100 and $32,200 from the IRS’s 2026 announcement. The Head of Household projected figure of $24,900–$24,950 is flagged in the research brief for verification against the official Revenue Procedure.
Ans: Projections point to a roughly 3.2% upward adjustment to income thresholds from 2026 to 2027 — larger than the 2.7% adjustment that applied from 2025 to 2026. The change is incremental: it moves the income levels where each rate begins, not the rates themselves. For the top 37% bracket, that translates to the projected threshold moving from $640,600 (single, official 2026) to $661,375 (single, projected 2027) — a difference of approximately $20,775. The statutory purpose of this annual adjustment is to prevent bracket creep as nominal incomes rise with inflation.
Ans: Your bracket depends on your filing status and your taxable income — gross income minus above-the-line deductions minus either the standard deduction or itemised deductions. It’s lower than your gross income. Once you have your estimated taxable income figure, compare it against the projected 2027 thresholds for your filing status. The SaveXpert Tax Bracket Calculator handles that comparison and shows both your marginal bracket (the rate on your last dollar of taxable income) and your effective tax rate (total tax divided by total taxable income). For most taxpayers, the effective rate is a more accurate reflection of overall tax burden than the marginal bracket alone.
Ans: The One Big Beautiful Bill Act (OBBBA) made three changes directly relevant to 2027 planning. First, it permanently preserved the seven TCJA ordinary income tax rates — 10%, 12%, 22%, 24%, 32%, 35%, and 37% — which were previously scheduled to expire. Second, it added an additional inflation adjustment specifically for the 10% and 12% brackets beginning in 2026, using different base years than the higher brackets under 26 U.S.C. §1. Third, it created a $6,000 senior deduction for eligible taxpayers age 65 and older during tax years 2025–2028, subject to income phaseouts detailed in the IRS OBBBA adjustments announcement. The permanent rate structure removes the sunset uncertainty that previously complicated multi-year tax planning.