

ⓘ Educational Disclosure:
This article is for educational and informational purposes only. It does not constitute financial, legal, tax, or lending advice. SaveXpert and its authors are not licensed financial advisors. Financial data changes frequently. Always consult a qualified financial professional before making any financial decisions.
To track net worth, apply the standard formula: Net Worth = Total Assets (what you own) minus Total Liabilities (what you owe). Assets include cash, savings, retirement accounts, investments, and property value. Liabilities include credit card balances, student loans, auto loans, and mortgage balances. According to the Federal Reserve 2022 Survey of Consumer Finances, the median U.S. household net worth is $192,900 — though this figure varies significantly by age group. A negative starting net worth is mathematically common and does not indicate long-term financial failure.
What This Research Found
- The formula is simple: Net Worth = Total Assets − Total Liabilities. Everything you own goes on one side; everything you owe goes on the other.
- Both the asset and the liability count. A home is an asset — but its mortgage is a liability. Only the equity (the difference) contributes to net worth. The same rule applies to any financed asset.
- Retirement accounts (401k, IRA, Roth IRA) are assets and belong on the balance sheet at their current market value.
- Track monthly or quarterly — not daily. Daily checks capture market noise, not real financial progress.
- Use the median, not the average, when benchmarking against Federal Reserve age data. A small number of ultra-wealthy households skew national averages far above what a typical household holds.
- Negative net worth is common for beginners. Young adults with student loans or a new mortgage frequently start below zero. The direction of change over time is what matters.
- Time To Read: 6 Minutes
Table of Contents
1. The Net Worth Formula — What It Measures and How It Works
2. Assets vs. Liabilities: What to Include and What to Avoid
3. How Often Should Beginners Track Net Worth?
4. Benchmarking: What Does Net Worth Look Like by Age?
Most people check their bank balance and call it a day. That number tells you what you can spend this week — not whether you’re actually building wealth.
Net worth does that. It’s the one number that captures everything at once: what you own, what you owe, and what’s left over after subtracting one from the other. I pulled together Federal Reserve Survey of Consumer Finances data, CFPB guidance, and IRS retirement account rules to put this together. The goal is straightforward: explain how to track net worth as a beginner, what the number actually means, and what moves the balance sheet in the right direction over time.
The Net Worth Formula — What It Measures and How It Works
A checking account balance is a snapshot of one account on one day. Net worth is the full picture — and the calculation runs on one equation:
Net Worth = Total Assets − Total Liabilities
Assets = what you own | Liabilities = what you owe
The number left after subtracting total liabilities from total assets is the baseline net worth — and that’s the number worth tracking consistently over time, not the balance of any single account.
Net Worth Balance Sheet Structure
| Column | What Goes Here | Examples |
|---|---|---|
| Total Assets (what you own) | Everything with monetary value you own outright or have equity in | Cash, savings, retirement accounts, investments, real estate, vehicles |
| Total Liabilities (what you owe) | All outstanding obligations to outside creditors | Credit cards, student loans, auto loans, mortgage balance, medical debt |
| Net Worth | Assets minus Liabilities | Positive, negative, or zero — all are valid starting points |
Do Retirement Accounts Count Toward Net Worth?
Yes. Retirement accounts — 401(k)s, 403(b)s, traditional IRAs, and Roth IRAs — are financial assets. Record the current market value of each account, not the amount originally contributed. Market value fluctuates, which is why tracking at consistent dates matters.
One point worth noting: whether to use pre-tax or after-tax values for traditional retirement accounts is a personal tracking choice. Either method is defensible. What matters is applying the same approach every time so that period-over-period comparisons stay accurate.
What About a Home and Its Mortgage?
Both go on the balance sheet — the home as an asset, the remaining mortgage balance as a liability. The equity between them is what contributes to net worth:
Home Equity in the Net Worth Calculation — Example
| Item | Column | Amount |
|---|---|---|
| Home market value | Asset | $400,000 |
| Remaining mortgage balance | Liability | $300,000 |
| Net home equity (contribution to net worth) | Net | $100,000 |
Recording the full property value without the accompanying mortgage would substantially overstate the real net worth position. The equity — not the market value — is the accurate figure to carry through to the total.

Enter your top assets and debts to see your net worth.
Assets vs. Liabilities: What to Include and What to Avoid
Getting the categories right from the start keeps every future calculation cleaner. The Federal Reserve SCF organizes household wealth into three broad asset categories and two liability types — a structure that works well for individual tracking too.
Assets (What You Own)
Liquid assets:
Checking accounts, savings accounts, high-yield savings accounts, money market funds, and cash equivalents. Accessible on short notice without a loss in value.
Investment and retirement assets:
401(k) plans, traditional and Roth IRAs, taxable brokerage accounts, individual stocks, bonds, mutual funds, and ETFs. Record current market value — not the contributed amount.
Illiquid and fixed assets:
Primary residence (current market value), rental real estate, vehicles (current market value), business equity, and significant personal property. These take time to convert to cash, but they count toward net worth just the same.
Liabilities (What You Owe)
Revolving liabilities:
Credit card balances, home equity lines of credit (HELOCs), and personal lines of credit. These fluctuate month to month as spending and payments occur.
Installment liabilities:
Mortgages, auto loans, student loans, personal loans, buy-now-pay-later (BNPL) balances, and medical debts on payment plans. These carry fixed repayment schedules and declining balances over time.
The Double-Counting Traps That Skew the Number
Double-counting is one of the most common beginner mistakes — and it quietly inflates net worth in ways that aren’t real. What I found when reviewing common tracking errors:
⚠️ Common Double-Counting Errors to Avoid:
- Counting the full home value and home equity as separate line items — the equity is already captured when you subtract the mortgage from the value.
- Listing a 401(k) total and individual stocks that are held inside that same 401(k) account.
- Adding a vehicle’s market value without including the remaining auto loan balance as a corresponding liability.
- Recording a brokerage account total and then separately listing individual holdings from within that same account.
The rule is straightforward: every asset and every liability appears exactly once. If in doubt, check whether two entries are actually the same thing described at different levels.
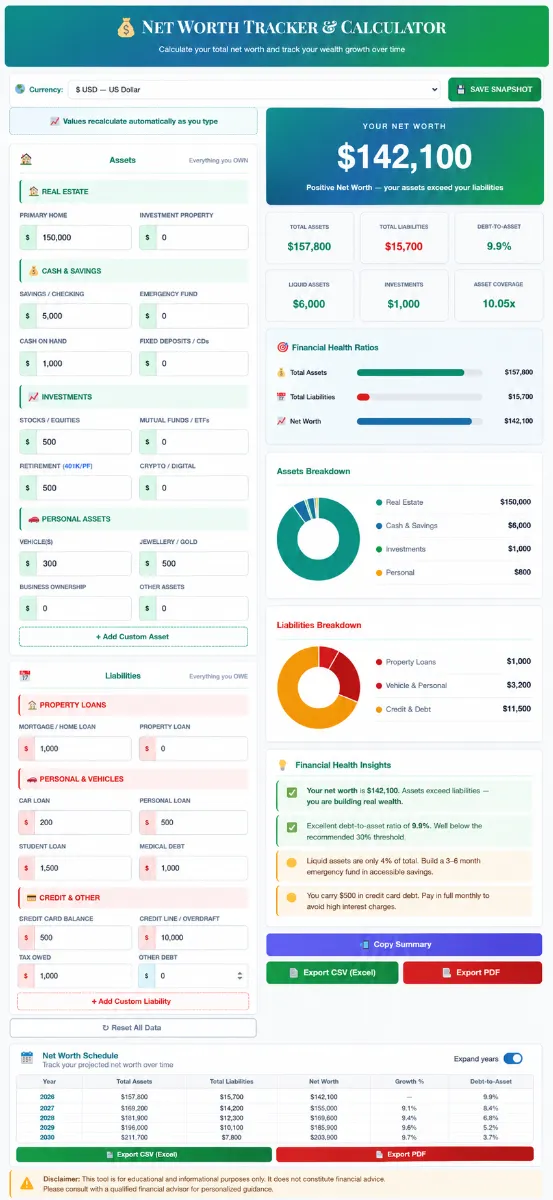
📈 Try the SaveXpert Net Worth Calculator
The SaveXpert Net Worth Calculator is free, browser-based, and requires no account or signup. Enter assets and liabilities across categories, and it computes the net worth position instantly — no spreadsheet formulas required.
Educational note: Calculator results are estimates for educational purposes only.
How Often Should Beginners Track Net Worth?
Checking net worth every day is a fast track to unnecessary stress. Stock prices swing. Home value estimates fluctuate. Credit card billing cycles create temporary balance differences that smooth out within days. None of those daily movements reflect actual changes in financial health — they’re noise.
A structured monthly or quarterly review catches what actually matters: debt being paid down, savings growing, retirement contributions compounding. The key is picking a consistent date — the last day of the month works well — and recording all account values as of that same date every time. Inconsistent timing creates comparisons that mislead.
Monthly tracking:
Works best for people actively working through debt repayment or building initial savings, where the balance sheet is changing meaningfully from month to month.
Quarterly tracking:
Works well once the financial picture is more stable — contributions are automated, debt is declining on schedule, and there’s less to actively monitor.
Either cadence produces far more useful data than daily checks. The goal is seeing the trend over 12, 24, and 36 months — not reacting to what the market did on a Tuesday.
Benchmarking: What Does Net Worth Look Like by Age?
The question beginners ask most often is: “Is my number good?” The Federal Reserve Survey of Consumer Finances (SCF) is the most comprehensive household wealth benchmark available in the U.S. Here’s what the data shows:
U.S. Household Net Worth by Age — Federal Reserve SCF 2022
| Age Group | Median Net Worth | Average Net Worth |
|---|---|---|
| Under 35 | $39,000 | $183,500 |
| 35–44 | $135,600 | $549,600 |
| 45–54 | $247,200 | $975,800 |
| 55–64 | $364,500 | $1,566,900 |
| 65–74 | $409,900 | $1,794,600 |
| All U.S. Households | $192,900 | $1,063,700 |
Source: Federal Reserve 2022 Survey of Consumer Finances (SCF), published 2023. Values in 2022 dollars. These are household-level figures; two-income households are included in the data
Why the Median Number Is the Right Comparison Point
The column that matters for most people is the median — not the average. The average net worth figures look dramatically higher because a relatively small number of ultra-wealthy households pull the national average far above what a typical household actually holds. The median, by definition, is the household sitting in the literal middle of the U.S. wealth distribution. That’s a far more honest comparison.
A few additional context points worth keeping in mind when using these benchmarks:
- These are 2022 figures. Market values, real estate prices, and debt levels have all shifted since the data was collected.
- They represent household wealth, not individual wealth. Two-income and multi-earner households are folded into the same brackets.
- Being below the median for an age group doesn’t indicate financial failure. It indicates a starting point — and starting points change.
The number worth watching isn’t today’s position relative to a benchmark. It’s whether net worth is trending upward over 12, 24, and 36 months of consistent tracking.
Two Levers for Growing Net Worth Over Time
Growing net worth comes down to two mechanical levers. Both can be pulled simultaneously, and pulling both is faster than pulling either one alone.
📈 Lever 1: Increase Productive Assets
- Add money regularly to high-yield savings accounts and cash reserves.
- Contribute consistently to tax-advantaged retirement accounts (401(k), IRA).
- Pay down mortgage principal to build real estate equity.
- Invest in diversified market index funds for long-term capital growth.
📋 Lever 2: Reduce Liabilities
- Pay off high-interest revolving credit card debt first.
- Eliminate personal loans and buy-now-pay-later balances.
- Pay down auto loans and student loans systematically.
- Avoid taking on new debt that doesn’t increase productive assets.
Reducing debt improves the balance sheet even when investment returns are flat — and markets do have bad years. Debt reduction doesn’t reverse. That asymmetry is one reason why paying down high-interest debt produces such reliable net worth improvement even during periods when the stock market underperforms.
One highly effective way to accelerate your net worth growth is by strategically allocating the ‘extra’ third paycheck you receive twice a year on a biweekly pay schedule.
How Compounding Amplifies Both Levers Over Time
Time does something to net worth that a single snapshot can’t show. A hypothetical $10,000 investment earning an assumed 7% annual compound return, left untouched for 20 years, grows to approximately $38,697 without a single additional contribution. Reinvesting returns creates momentum that compounds on itself each year.
That’s not a guarantee of any specific return — investment results vary, and past performance doesn’t predict future outcomes. It’s an illustration of why starting early and staying consistent carries a mathematical advantage that catching up later struggles to replicate. The earlier contributions start, the more years that compounding momentum has to build.
“Checking a bank balance tells you what you can spend today. Tracking net worth tells you whether the balance sheet is actually moving in the right direction — debt shrinking, assets growing, equity building. That’s the number worth watching consistently.”
— Kevin Brown, Lead Researcher at SaveXpert.com
Frequently Asked Questions
Ans: Yes. Retirement accounts — 401(k)s, 403(b)s, traditional IRAs, and Roth IRAs — are financial assets and belong on the balance sheet. Record the current market value of each account, not the amount originally contributed. The key is applying the same method (pre-tax or after-tax values) every time so period-over-period comparisons remain accurate.
Ans: Yes, with one requirement: the remaining mortgage balance must also be listed as a liability. The home’s current market value goes in the assets column; the outstanding loan balance goes in the liabilities column. The difference — home equity — is what contributes to net worth. Recording only the property value without the mortgage would significantly overstate the true financial position.
Ans: A negative net worth means liabilities currently exceed assets. According to Federal Reserve SCF data, this is mathematically common for young adults and recent graduates who are carrying student loans or a new mortgage while building initial savings. A negative starting number is a measurement, not a verdict. The direction of change over 12, 24, and 36 months of consistent tracking is what matters — not the absolute figure on day one.
Ans: Monthly or quarterly reviews are sufficient for most people. Daily tracking captures stock price swings, billing cycle timing differences, and interest accruals that don’t reflect real financial progress. Monthly reviews work well for anyone actively paying down debt or building initial savings. Quarterly works once the picture is more stable. Whatever cadence is chosen, recording all balances on the same calendar date each period is what keeps the comparisons clean.
Ans: Income is a flow — money earned during a specific period, such as a paycheck or monthly freelance revenue. Net worth is a stock — accumulated wealth at a point in time, calculated as total assets minus total liabilities. High income does not automatically produce high net worth if spending equals or exceeds earnings. Conversely, someone with modest income who consistently saves and invests over many years can build significant net worth through compounding. The CFPB frames this distinction as the difference between cash flow (what comes in and out) and financial position (what’s actually accumulated).
Ans: According to Federal Reserve SCF microdata, approximately 18% of U.S. households — roughly 1 in 6 — hold a net worth of $1,000,000 or more, including real estate equity and nonfinancial assets. This reflects household-level wealth, not individual wealth, and the threshold includes all asset types tracked by the SCF.