
ⓘ Educational Disclosure:
This article is for educational and informational purposes only. It does not constitute financial, legal, tax, lending, or investment advice. SaveXpert and its authors are not licensed financial advisors, CPAs, attorneys, or tax advisors. All data comes from publicly available government and institutional sources. Always consult a qualified professional before making investment decisions.
How do credit card rewards work? Credit card rewards work by returning a portion of the merchant interchange fees that issuers collect on each transaction back to the cardholder. When you use a card, the merchant pays an interchange fee — typically 1%–3% of the transaction. The issuer keeps most of that revenue and returns part of it to cardholders through cash back, points, or miles programs. According to the CFPB’s 2025 market report, general-purpose cards returned an average of 1.6 cents in rewards per dollar spent in 2024. Rewards cards handled 92% of general-purpose purchase volume, and Americans earned $47.5 billion in total rewards — $23.9 billion in points, $16.6 billion in cash back, and $6.6 billion in miles. That same year, however, Americans paid $160 billion in credit card interest — a 3.4:1 ratio that shows why rewards only represent a net benefit when balances are paid in full.
Key Takeaways
- Problem: Most Americans don’t know how credit card rewards are funded — or that paying $160 billion in credit card interest in 2024 while earning $47.5 billion in rewards means the interest side of the market is 3.4 times larger than the rewards side.
- Solution: Rewards work by returning a fraction of merchant interchange fees to cardholders — averaging 1.6 cents per dollar spent. Cash back is the simplest structure; travel points require attention to redemption values that can range from 0.52 cents to 6+ cents per point depending on how they’re used.
- Result: Rewards produce real value only when balances are paid in full each month. Nearly 1 in 4 cardholders redeemed no rewards during 2024 — contributing to $4.5 billion in unredeemed balances — meaning the earn rate is only half the equation.
- Source: CFPB Consumer Credit Card Market Report 2025
- Time To Read: 8 Minutes
Table of Contents
1. Where Credit Card Rewards Actually Come From
2. Cash Back, Points, and Miles: How Each One Works
3. Are Rewards Worth It When You Carry a Balance?
4. What Happens to Rewards That Go Unclaimed?
5. Are Credit Card Rewards Taxable?
7. What the CFPB Research Flags About Chasing Rewards
8. What the Research Shows Works (and What Doesn’t)
9. Bottom Line: 5 Steps to Actually Profit From Credit Card Rewards
Americans earned $47.5 billion in credit card rewards during 2024. They paid $160 billion in credit card interest the same year. That’s not a coincidence — it’s the context the CFPB’s Consumer Credit Card Market Report puts on the table before any rewards rate comparison starts. Understanding how credit card rewards actually work begins with understanding where the money comes from and who benefits most from the system.
Where Credit Card Rewards Actually Come From
Rewards aren’t funded from nothing. The research identifies a specific economic chain that connects a merchant transaction to the cash back or points a cardholder receives.
When a cardholder swipes at a merchant, the merchant pays an interchange fee — typically 1%–3% of the transaction value — to the issuer through the card network. This interchange revenue is the primary funding mechanism for rewards programs. The issuer keeps the larger portion of that fee as revenue, then returns a fraction to the cardholder in the form of rewards.
| Layer | Who Receives Value | How |
|---|---|---|
| Interchange fee collected | Card issuer (primarily) | Roughly 1%–3% of each transaction paid by merchant |
| Rewards distributed | Cardholder | Avg. 1.6 cents per dollar (CFPB 2024 general-purpose average) |
| Net interchange retained | Issuer | 1.1% of average receivables after distributing rewards; 0.3% of annual purchase volume net of interchange and rewards expenses |
The 2024 rewards earnings breakdown
| Reward Type | Total Earned (2024) | Share of $47.5B Total |
|---|---|---|
| Points | $23.9 billion | 50% |
| Cash back | $16.6 billion | 35% |
| Miles | $6.6 billion | 14% |
| Other | ~$0.4 billion | ~1% |
Rewards cards accounted for 92% of general-purpose purchase volume in 2024, with cash-back cards representing 36% of general-purpose card accounts. Rewards programs are no longer a niche product. They’re built into the structure of how most consumer card spending works.
💡 Research note: The interchange-funding model means rewards are partly cross-subsidised by merchants — and indirectly by consumers who don’t use rewards cards, since merchants typically can’t price differently by card type. The CFPB has examined this dynamic in its market reports. It’s useful context when evaluating how “free” rewards actually are at a system level.
Cash Back, Points, and Miles: How Each One Works
The research identifies three major reward structures. They differ significantly in how value is expressed, what determines actual worth, and how complexity varies at redemption.
| Reward Type | How Value Is Expressed | Typical Return | Complexity at Redemption |
|---|---|---|---|
| Cash back | Dollar value; directly equivalent | Generally 1.5%–2% (flat-rate cards); 3%–6% in specific categories | Low — straightforward dollar equivalent |
| Points | Point units; value depends on redemption choice | Avg. base earn of 1.19 pts/$ (WalletHub); 2X can equal ~3% cash-back equivalent at 1.5¢/point (Investopedia methodology) | Medium — redemption method determines actual value |
| Miles/travel rewards | Miles or points tied to travel network | Varies widely: 0.52¢–2.5¢+ per point (one source range); 1.5¢–6¢+ per point (another source range) | High — transfer partners, booking methods, and category affect value significantly |
Source: CFPB Consumer Credit Card Market Report 2025 · WalletHub earn-rate data · Investopedia methodology
Why cash back and travel rewards aren’t directly comparable
Cash back has a one-to-one relationship with dollar value. A 2% cash-back reward on a $100 purchase produces $2 with no further steps required.
Points and miles don’t work that way. A 2X points card may appear to return twice as much as a 1X card — but the actual value depends entirely on the redemption. At 1.5 cents per point (Investopedia’s methodology example), 2X points produce a 3% cash-back equivalent. But at 0.52 cents per point through a lower-value redemption path, the same 2X card produces just 1.04% equivalent — below the flat-rate cash-back alternative.
The research reports that poor redemption choices can reduce travel point value by 50% or more. That makes the advertised earn rate on a travel card only half the equation.
Bankrate survey data cited in the research brief found that 50% of rewards cardholders preferred cash back as their primary card feature. The simplicity of the value calculation is a real advantage for most cardholders who don’t want to track point valuations across multiple redemption partners.

Are Rewards Worth It When You Carry a Balance?
This is the finding that changes the entire rewards conversation.
| 2024 Market Figure | Amount | Source |
|---|---|---|
| Total credit card interest paid | $160 billion | CFPB Consumer Credit Card Market Report 2025 |
| Total credit card rewards earned | $47.5 billion | CFPB Consumer Credit Card Market Report 2025 |
| Gap (interest minus rewards) | $112.5 billion | Derived from above |
| Interest-to-rewards ratio | 3.4:1 | Derived from above |
The research doesn’t say every cardholder paid more interest than they earned in rewards. These are aggregate market totals. But the ratio illustrates the scale of the difference between what interest charges cost the market and what rewards return to it.
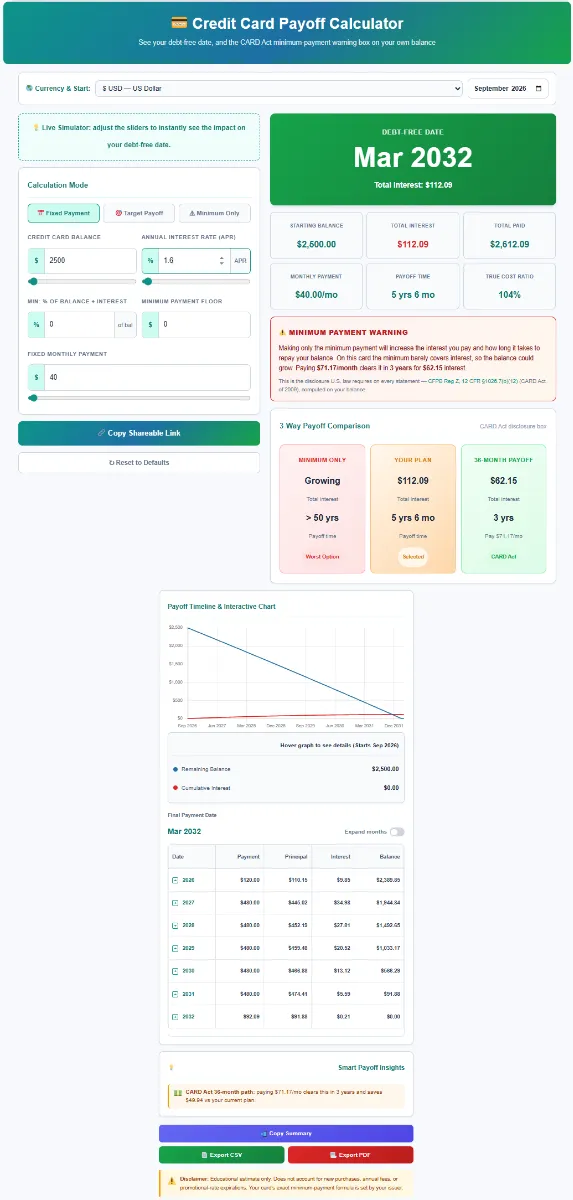
Find out how long it takes to clear your card — and the interest cost.
The per-cardholder math
At the CFPB’s reported average of 1.6 cents per dollar, a cardholder spending $2,500 per month earns roughly $40 in rewards monthly — or approximately $480 annually. That’s a meaningful number in a pay-in-full context.
The same cardholder carrying a $2,500 balance at an approximately 20% APR (the example used in the research brief) pays roughly $500 in interest annually — slightly more than the full year of rewards before that interest is even considered. And the 20% figure is itself conservative relative to the CFPB’s reported 2024 average of 25.2% for general-purpose cards.
⚠️ The 0% promotional carry-over finding: The CFPB’s market report found that accounts with introductory 0% APR promotions carried balances 69% higher by 36 months after account opening compared to non-promotional accounts. Promotional financing and rewards can overlap on the same card — and the research indicates that the reward earned doesn’t offset the financing cost that follows when the 0% period expires.
💳 See the Real Numbers: SaveXpert Credit Card Payoff Calculator
I ran a $2,500 monthly spending scenario through the Credit Card Calculator using the CFPB’s reported 1.6% average rewards figure. The result: about $40 in rewards per month, or roughly $480 per year before annual fees and interest. Then I entered a $2,500 carried balance at 20% APR. The interest cost exceeded the annual rewards total. Entering your actual spending, your card’s rewards rate, and your carry behaviour turns those two abstract totals into a number specific to your situation.
Educational note: This calculator models scenarios for informational purposes only and does not constitute financial advice. Source: CFPB Consumer Credit Card Market Report 2025
What Happens to Rewards That Go Unclaimed?
Earning rewards and receiving value from them aren’t the same thing. The research data makes this explicit.
| Rewards Metric | 2024 Figure |
|---|---|
| Total rewards redeemed | $43 billion |
| Total rewards unredeemed | $4.5 billion |
| Cardholders who redeemed no rewards | Nearly 1 in 4 |
| CFPB complaints involving rewards misadministration | More than 1,200 |
The $4.5 billion in unredeemed rewards represents value that cardholders earned but didn’t collect. Nearly a quarter of cardholders — who presumably selected rewards cards specifically to benefit from those programs — redeemed nothing during the full year.
What the CFPB’s complaint data shows about rewards problems
The CFPB has identified several recurring themes in rewards-related consumer complaints. These aren’t edge cases — they reflect the administrative complexity built into many rewards programs.
| Complaint Category | What It Covers |
|---|---|
| Unexpected promotional conditions | Terms that weren’t clear at sign-up affecting when or how rewards can be earned or redeemed |
| Devaluation | Issuers reducing the cash value of existing point balances without adequate notice |
| Redemption problems | Cardholders unable to redeem rewards as advertised; technical or administrative barriers |
| Revocation | Rewards cancelled, often for account closures, inactivity, or disputed policy violations |
Source: CFPB consumer complaints and market research · Regulation Z §1026.60
Regulation Z Section 1026.60 governs credit card applications and solicitations, including required disclosures about rewards terms and redemption rules. The regulation exists partly because reward program terms are complex enough that consumers have historically had difficulty comparing them accurately at application time.
Are Credit Card Rewards Taxable?
The research brief draws a clear distinction between two types of rewards — and their tax treatment differs.
| Reward Type | Tax Treatment | IRS Basis |
|---|---|---|
| Rewards earned through spending (cash back, points, miles on purchases) | Generally treated as a purchase rebate — not taxable income | IRS Publication 525 |
| Sign-up or referral bonuses not requiring spending | May be treated as taxable income; 1099-MISC potentially issued | IRS Publication 525 · OBBBA §70433 |
| 2026 Form 1099-MISC reporting threshold | $2,000 from a single payer (raised from $600 by OBBBA) | One Big Beautiful Bill Act §70433 — effective 2026 |
Source: IRS Publication 525 · OBBBA §70433
The key principle: when a reward is earned by spending money — cash back on a $500 grocery purchase, for example — the IRS generally treats that reward as a rebate on the purchase price rather than as additional income. The distinction makes sense economically: you’re receiving back a portion of money you already spent, not receiving new income.
Bonuses that don’t require spending — certain referral payments, welcome offers tied to no spending threshold — can look more like income than rebates. The research brief points readers to IRS Publication 525 for the applicable tax treatment.
⚠️ The 2026 threshold change: The One Big Beautiful Bill Act (OBBBA) raised the Form 1099-MISC reporting threshold from $600 to $2,000 for 2026. A card issuer must issue a 1099-MISC only when taxable rewards (those treated as income, not rebates) reach $2,000 or more from that issuer in a calendar year. Below the threshold, no form is required — but the underlying tax rule about whether the reward constitutes income still applies. The threshold change is a reporting change, not a tax exemption.
How Sign-Up Bonuses Work
A sign-up bonus gives new cardholders additional rewards after meeting specific conditions — typically a spending threshold within a defined window after account opening.
The research brief reports an average initial bonus of 35,483 miles or points (WalletHub data). That figure describes the average across tracked cards — not a universal standard. Individual offers vary significantly by issuer, card tier, and promotional period.
Several important limits apply to sign-up bonus analysis:
Spending requirements vary.
One issuer’s $500-minimum bonus offer has different economics than another issuer’s $3,000-minimum offer. The research brief doesn’t provide a universal spending requirement because none exists across all cards.
The points must be redeemable at a useful value.
An average bonus of 35,483 points worth 0.52 cents each produces $184.51 in value. The same points worth 1.5 cents each produce $532.25. The sign-up bonus number alone doesn’t establish the actual dollar value.
Tax treatment may differ from earned rewards.
As covered in the section above, bonuses not tied to spending may receive different tax treatment than spending-based rewards.

What the CFPB Research Flags About Chasing Rewards
The research identifies several patterns the data consistently associates with rewards-related financial loss. These aren’t speculative concerns — they’re grounded in the CFPB’s market report and enforcement data.
Carrying balances while focusing on rewards
The $160 billion in interest vs. $47.5 billion in rewards comparison is the clearest finding. The research treats this ratio as evidence that, in the aggregate, interest costs from carried balances dwarf the value of rewards earned. A cardholder simultaneously accumulating rewards and paying 25% APR on a revolving balance is doing the math in the wrong order.
Chasing complex travel rewards without tracking redemption values
The research reports travel point valuations ranging from 0.52 to 2.5+ cents per point — and notes that poor redemption choices can reduce point value by 50% or more. A cardholder optimising for earn rate without attention to redemption value may end up with fewer real dollars than a flat 1.5% cash-back card would have produced.
Manufactured spending
The research brief identifies manufactured spending — creating artificial transactions to generate rewards — as an area of concern. The brief notes that IRS and DOJ scrutiny has flagged certain manufactured spending arrangements as potentially fraudulent. It also cites a 2025 American Express settlement involving a rewards program, resulting in a $138 million payment.
Annual fees that exceed reward returns
The research brief estimates that Americans paid approximately $4.8 billion in annual fees in the period covered. It specifically notes that annual fees can exceed rewards for low spenders. A cardholder paying a $95 annual fee and earning 1.6% in rewards needs to spend at least $5,938 annually just to break even on the fee — before any interest costs are considered.
What the Research Shows Works (and What Doesn’t)
What the CFPB data consistently supports
Paying the full balance every month.
The entire rewards benefit structure breaks down when interest charges begin accruing. At the CFPB’s reported 25.2% average APR, a single month of carrying a $2,500 balance costs approximately $52.50 in interest — already 130% of the $40 monthly reward the same spending generates. Rewards are a net benefit only when the interest column stays at zero.
Choosing cash back when redemption complexity matters.
The research puts cash-back percentages at 1.5%–2% for flat-rate cards and 3%–6% for category-specific cards. Cash back has a transparent dollar value. The Bankrate survey cited in the brief — 50% of rewards cardholders preferred cash back — reflects that preference for simplicity. For a cardholder who won’t track point valuations across redemption partners, a straightforward cash-back card typically produces more predictable value than a travel card offering nominally higher earn rates.
Actually redeeming the rewards earned.
Nearly 1 in 4 cardholders redeemed no rewards during 2024. $4.5 billion in value went uncollected. Selecting a rewards program is only half the decision — the other half is maintaining a habit of actually using what you earn.
Evaluating annual fees against realistic spending.
The break-even calculation is straightforward: annual fee divided by the rewards rate equals the minimum annual spend where rewards offset the fee. A $95 fee on a 2% card breaks even at $4,750 in annual spend. Below that, a no-fee card with a lower rate may produce higher net value.
What the data says doesn’t work
Treating the earn rate as the primary comparison metric.
Earn rate alone doesn’t account for redemption value variation (travel), annual fees, interest costs, or whether the cardholder will actually redeem. The CFPB’s market data consistently shows that the full economics of a card — not the headline rate — determine actual returns.
Assuming higher earn rates mean higher value.
A 3X points card at 0.52 cents per point yields 1.56% equivalent. A flat 2% cash-back card yields 2%. The points card’s headline looks better; the cash-back card’s actual return is higher at that redemption value.
Chasing sign-up bonuses without calculating spending requirements.
A 35,000-point bonus requiring $3,000 in three months creates a $1,000/month spending floor that may not reflect normal behaviour — and may encourage overspending to hit the threshold.

Bottom Line: 5 Steps to Actually Profit From Credit Card Rewards
1. Pay the full statement balance every month — this is the only rule that actually makes rewards valuable:
The CFPB’s data shows $160 billion in interest paid against $47.5 billion in rewards earned in 2024 — a 3.4:1 ratio. At the CFPB’s reported 25.2% average APR, a $2,500 monthly balance costs roughly $52.50 per month in interest — already exceeding the ~$40 monthly reward the same spending generates. Rewards are a net benefit only when the interest column stays at zero. Run your own scenario through the Credit Card Calculator to see the exact crossover point for your card’s APR and spending level.
2. Calculate the annual fee break-even before choosing a card with one:
The research estimates $4.8 billion in annual fees paid by Americans, and notes that fees can exceed rewards for low spenders. The calculation is: divide the annual fee by the reward rate percentage to find the annual spending needed for rewards to exceed the fee. A $95 fee on a 2% card breaks even at $4,750/year ($396/month). Below that spending level, a no-fee card with a slightly lower rate likely returns more net value.
3. Check redemption value before choosing a travel card over cash back:
Travel points range from 0.52 cents to 6+ cents per point depending on how they’re redeemed — and the research reports that poor choices can reduce value by 50% or more. Before selecting a travel card that earns 2X or 3X points, calculate whether your likely redemption method (statement credit, travel portal, transfer partner) produces a per-point value above or below a flat cash-back card. The earn rate means nothing if the redemption value undercuts it.
4. Set a calendar reminder to redeem rewards quarterly — don’t let them accumulate unused:
Nearly 1 in 4 cardholders redeemed no rewards during 2024, contributing to $4.5 billion in unclaimed balances. Rewards can expire, be devalued, or be revoked under circumstances the CFPB has documented in over 1,200 complaints. A reward you earned but never redeemed returned nothing. Set a recurring quarterly review to check your rewards balance and redeem any amount worth collecting.
5. Match the card to your spending pattern — not to the highest headline earn rate:
The CFPB’s data shows that category-specific cards can earn 3%–6% in high-spend categories. If your actual spending concentrates in one or two categories (groceries, gas, dining), a category card optimised for those purchases may outperform a flat-rate 2% card. But a card that earns 5X on a category you rarely use returns far less than its headline rate implies. Run your three largest monthly spending categories through the calculator to see which card structure produces the most value against your actual behaviour.
“When I went through the CFPB’s 2025 market report, the number that most changed my view of rewards programs wasn’t the $47.5 billion earned. It was the $160 billion in interest paid the same year — a 3.4:1 ratio. The research doesn’t say rewards are worthless. It says they’re a benefit only when you’re on the right side of that ratio. And the data shows nearly 1 in 4 cardholders didn’t even redeem the rewards they earned.”
— Kevin Brown, Lead Researcher at SaveXpert.com
Frequently Asked Questions
Ans: According to the CFPB’s Consumer Credit Card Market Report, credit card rewards work by returning a fraction of the merchant interchange fees an issuer collects back to the cardholder. When you make a purchase, the merchant pays an interchange fee of roughly 1%–3% to the issuer. The issuer distributes part of that revenue to cardholders through rewards programs — averaging 1.6 cents per dollar on general-purpose cards in 2024. Points, miles, and cash back are all funded through this same interchange mechanism; they differ in how value is expressed and what redemption determines actual worth.
Ans: Cash back returns a straightforward percentage of spending as a dollar-equivalent value — typically 1.5%–2% on flat-rate cards and 3%–6% in specific high-spend categories. Travel rewards return points or miles whose value depends heavily on the redemption method. The research brief cites travel point valuations ranging from 0.52 to 2.5+ cents per point (one source range) and 1.5 to 6+ cents per point (another source range). Poor redemption choices can reduce travel point value by 50% or more. A Bankrate survey cited in the brief found that 50% of rewards cardholders prefer cash back — a preference that reflects the transparency of a direct dollar value over the complexity of travel point management.
Ans: The CFPB’s 2024 market data makes this case directly: Americans earned $47.5 billion in rewards and paid $160 billion in credit card interest — a 3.4:1 ratio. At the CFPB’s reported average APR of 25.2% for general-purpose cards, a $2,500 balance costs roughly $630 per year in interest — more than the ~$480 in annual rewards a cardholder spending $2,500 monthly would earn at the CFPB’s 1.6-cent average. When a balance carries, the interest cost typically exceeds the reward benefit. The research explicitly treats rewards as a net benefit only when balances are paid in full.
Ans: According to IRS Publication 525, rewards earned through regular spending are generally treated as rebates on purchases rather than taxable income. A 2% cash-back reward on a $500 grocery purchase is treated as reducing the cost of the purchase, not as additional income. However, certain sign-up or referral bonuses that don’t require spending may be classified as taxable income. The 2026 Form 1099-MISC reporting threshold is $2,000 from a single payer — raised from $600 by the OBBBA —, but the threshold change is a reporting change, not a tax exemption. Rewards that are taxable remain taxable below the threshold.
Ans: The CFPB’s research identifies several risk patterns. The $160 billion interest vs. $47.5 billion rewards comparison is the most prominent finding — it shows that carrying a balance to chase rewards produces a net loss at market-average rates. The CFPB also identifies recurring complaint themes: unexpected promotional conditions, reward devaluation by issuers, redemption barriers, and reward revocation. Its 2025 market report documented over 1,200 complaints involving rewards misadministration. The research treats rewards as part of a credit product with full economics — not as isolated free money separate from APR, fees, and redemption complexity.
Ans: The One Big Beautiful Bill Act (OBBBA) raised the Form 1099-MISC reporting threshold from $600 to $2,000 for 2026 and later. An issuer must issue a Form 1099-MISC only when taxable rewards — those classified as income rather than rebates, such as certain sign-up or referral bonuses not tied to spending — reach $2,000 or more from that issuer in a calendar year. Below the threshold, no form is required, but the IRS rules on taxable income still apply. Rewards earned through regular spending are generally treated as rebates regardless of amount. See IRS Publication 525 for the applicable treatment and consult a tax professional for guidance on specific rewards or bonuses.