ⓘ Educational Disclosure:
This article is for educational and informational purposes only. It does not constitute financial, legal, tax, or investment advice. SaveXpert and its authors are not licensed financial advisors. Investments do not have a set rate of return; actual results can be higher, lower, or negative. Always consult a qualified professional before making investment decisions.
The surprising part about making $1,000 a month from investments isn’t the target — it’s how dramatically the portfolio requirement shifts when the assumed income rate changes. At 2%, the arithmetic says you need $600,000. At 6%, the same target requires only $200,000. That $400,000 gap depends entirely on one assumption that no government source guarantees.
Key Takeaways
- Problem: Many everyday Americans want to generate $1,000 a month from investments but don’t know the exact portfolio size required — or how long it actually takes to get there.
- Solution: Research shows you generally need a portfolio between $240,000 (at a 5% annual income rate) and $300,000 (at 4%) to produce $12,000 per year. The timeline depends on your monthly contribution — from 30+ years at $250/month to 14.7 years at $1,000/month, assuming a 7% annual return.
- Result: No single portfolio size fits every situation. Taxes, fees, inflation, and whether your portfolio actually generates cash income all change the real-world outcome significantly.
- Source: Investor.gov — SEC Investing Basics · Federal Reserve 2022 Survey of Consumer Finances
- Time To Read: 8 Minutes
Table of Contents
1. How Much to Invest to Make $1,000 a Month?
2. Why the Math Is More Complicated Than It Looks
3. How Long Does It Take to Build a $300,000 Portfolio?
4. How Taxes, Retirement Accounts, and Inflation Change the Picture
5. What the Data Shows Works Consistently
6. Can You Live Off Investment Income Alone?
How much do you need to invest to make $1,000 a month? According to Investor.gov, you typically need an investment portfolio between $240,000 (at a 5% annual income rate) and $300,000 (at a 4% rate) to generate $12,000 annually — or $1,000 per month. These are arithmetic illustrations, not guaranteed returns. Investor.gov explicitly states that investments don’t have a set rate of return.
I spent time going through the Investor.gov and SEC materials, Federal Reserve household data, BLS spending data, and IRS figures on this. The research consistently shows one thing: the question most people ask — “how much do I need to invest?” — actually contains four separate sub-questions, and they don’t all produce the same answer.
How Much to Invest to Make $1,000 a Month?
The calculation starts with one simple formula: divide the annual income target by the assumed annual income rate. A $1,000 monthly target equals $12,000 per year. From there, the required portfolio size depends entirely on what income rate you assume.
Table 1 — Portfolio Size Required to Generate $1,000 a Month
| Assumed Annual Income Rate | Calculated Portfolio Size | Note |
|---|---|---|
| 2% | $600,000 | Illustrations only — investments have no set rate of return. Investor.gov |
| 3% | $400,000 | |
| 4% | $300,000 | |
| 5% | $240,000 | |
| 6% | $200,000 | |
| 7% (historical-estimate range, per Investor.gov) | $171,429 | Total return ≠ guaranteed cash income. Historical performance doesn’t predict future results. |
| 10% (top of historical-estimate range, per Investor.gov) | $120,000 | Total return ≠ guaranteed cash income. Historical performance doesn’t predict future results. |
Source: SaveXpert calculations based on methodology described at Investor.gov. The 7%–10% historical-estimate range comes from Investor.gov’s long-term diversified U.S. stock investment examples. These are illustrations, not guaranteed returns or income rates.
The 7% and 10% rows require extra caution. They represent total-return illustrations based on the historical-estimate range cited by Investor.gov — not guaranteed dividend yields or guaranteed monthly cash income. A portfolio that grows at 7% doesn’t automatically generate 7% as spendable income each year.
Why the Math Is More Complicated Than It Looks
Many investors start with the monthly target rather than the portfolio math behind it. That creates a common confusion: mixing up a portfolio’s growth rate with the amount it can actually distribute as monthly income.
The SEC explains that fund distributions can come from dividends, interest, capital gains, or return of capital — and that distributions don’t equal fund performance. Investor.gov states clearly that a fund can make distributions while its overall value performs poorly. A distribution rate by itself doesn’t show what the underlying investment actually earned. That distinction matters when estimating monthly income from a portfolio.
⚠️ Return of capital warning: The SEC also warns that distributions can include return of capital — meaning part of a distribution can be the investor’s own money being returned, not investment earnings. A distribution rate that looks attractive may be partly eroding the portfolio’s principal, not growing it.
I found another reality check in Federal Reserve household data. In the 2022 Survey of Consumer Finances, the median financial-asset value among families holding financial assets was only $39,000. The median retirement-account balance among families holding such accounts was $86,900. A $300,000 portfolio sits well above the median for American families — it’s a meaningful long-term target, not a baseline.
The Federal Reserve also reported that approximately $404,000 was the conditional mean for direct stock holdings among families that held such assets. That’s a mean among a specific group — not a typical household balance. Means can make balances appear more common than they really are.
💡 Research note: Investor.gov also states that higher potential returns generally involve higher risk, and that diversification can reduce the effect of one investment losing value — but can’t eliminate losses. The 7%–10% historical estimate describes long-term, diversified U.S. stock market performance. It’s not available as a guaranteed annual income yield from a simple portfolio.

How Long Does It Take to Build a $300,000 Portfolio?
I ran the accumulation figures using a $300,000 target, a 7% annual return assumption, monthly compounding, and contributions at the end of each month. The 7% figure comes from the historical-estimate range described by Investor.gov. Actual returns can be higher, lower, or negative.
Table 2 — Years to Reach $300,000 by Monthly Contribution (at 7% Assumed Annual Return)
| Monthly Contribution | Approximate Time to $300,000 |
|---|---|
| $250 | 30.3 years |
| $500 | 21.9 years |
| $1,000 | 14.7 years |
| $1,500 | 11.2 years |
| $2,000 | 9.1 years |
Source: SaveXpert calculations. Assumes 7% annual return (the lower end of the historical-estimate range per Investor.gov), monthly compounding, contributions at end of month, $0 starting balance. Real results will differ.
The contribution amount moves the timeline more sharply than almost any other variable. Going from $500 to $1,000 per month saves roughly 7 years. Going from $250 to $500 saves about 8 years. That relationship — between contribution size and timeline — is more predictable than any assumption about market returns.
The Federal Reserve data also shows that 54.3% of families held retirement accounts in 2022. Among those families, the median retirement-account balance stood at $86,900 — roughly 29% of the $300,000 arithmetic target at a 4% income rate. Most families building toward this goal are starting from a meaningful distance behind it.
How Taxes, Retirement Accounts, and Inflation Change the Picture
A $300,000 portfolio at 4% produces $12,000 per year before taxes, fees, and inflation. What that actually means for a real bank account is a different calculation.
2026 IRS Contribution Limits
The IRS rules around retirement accounts shape how quickly someone can build toward an investment portfolio. For 2026, the IRS set the following limits:
- Employee deferral limit for 401(k), 403(b), governmental 457(b), and TSP accounts: $24,500.
- General catch-up for age 50 and older: $8,000.
- Enhanced catch-up for ages 60–63: $11,250.
- Overall defined-contribution annual additions limit: $72,000 (subject to compensation limits).
- Combined traditional and Roth IRA contribution limit: $7,500 (rising to $8,600 for age 50 and older).
Traditional IRA required minimum distributions generally begin at age 73, per IRS Publication 590-B. A 10% additional tax generally applies to taxable IRA distributions before age 59½ unless an exception applies, per IRS Topic 557.
Dividend and Capital Gain Tax Rates for 2026
Ordinary dividends generally enter ordinary income. Qualified dividends may receive lower capital-gain rates when they meet the qualification rules, per IRS Topic 404.
For 2026, the IRS published long-term capital-gain and qualified-dividend thresholds with the following zero-rate maximums:
- Single filers: $49,450.
- Heads of household: $66,200.
- Married filing jointly: $98,900.
The maximum 15% rate thresholds are $545,500 (single), $579,600 (heads of household), and $613,700 (married filing jointly). Amounts above those thresholds can face the 20% rate.
💡 Research note: The 0% qualified-dividend and capital-gain rate means a single filer with total income under $49,450 in 2026 may owe no federal tax on qualified dividends or long-term capital gains. Whether this applies depends on total income, filing status, and the specific investments held. Consult a qualified tax professional for personal tax situations.
What BLS Inflation Data Means for a Fixed Monthly Target
The Bureau of Labor Statistics reported that CPI-U rose 0.1% in July 2026, with a 3.4% increase over the prior 12 months and core CPI up 2.5%. A fixed $1,000 monthly target that stays constant in dollar terms loses purchasing power as prices rise. Building an income target without adjusting for inflation creates a gap that widens every year.
The Federal Reserve also maintained a federal funds target range of 3.50%–3.75% in July 2026, with the rate paid on reserve balances at 3.65%. Those are monetary-policy rates — not guaranteed returns available to individual investors.
Estimate your lump-sum investment growth over time.

What the Data Shows Works Consistently
Based on what I found in the Investor.gov and SEC materials, several approaches consistently show evidence of supporting long-term investment portfolio growth.
Investor.gov describes regular investing and time as core drivers of compound growth. Its examples show that a larger monthly contribution reduces the time needed to reach a future portfolio target — consistent with the accumulation table above.
The SEC also supports diversification as a method to reduce the effect of one investment losing value. It can’t eliminate losses, but it can reduce concentration risk across a single company, sector, or asset class.
Lower investment costs matter too. SEC materials state that fees reduce investor returns, and that index funds generally charge lower fees than actively managed funds. Historical data shows a benefit from lower costs over time.
Reinvesting distributions during the accumulation phase can also increase the number of shares held. The SEC explains that reinvesting buys additional shares and can help the investment grow over time. The SEC’s own compound-interest calculator at Investor.gov illustrates how recurring investment growth builds over extended periods.
The research also supports evaluating total return and standardised yield rather than a fund’s headline distribution rate. A large distribution doesn’t automatically mean strong investment performance — it may include return of capital.
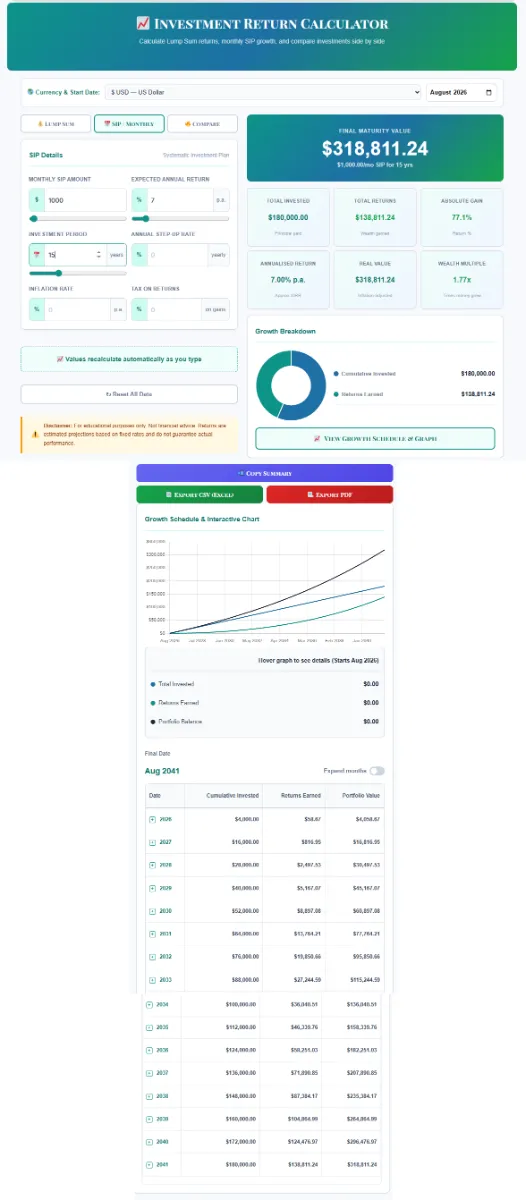
💰 Run Your Numbers with the SaveXpert Investment Return Calculator
I ran a $1,000 monthly contribution toward a $300,000+ target at 7% and got approximately 15 years. Changing the contribution to $500 pushed that to 21.9 years — a 7-year difference from one input change. The contribution amount changes the timeline more sharply than almost any return assumption. Enter your own starting balance, monthly contribution, and expected return to see how your personal timeline compares to the table above
Also useful: Compound Interest Calculator — model recurring contributions and reinvested returns over time, consistent with the SEC’s own compound-interest illustration approach.
Educational note: These calculators model hypothetical scenarios using your selected inputs. They don’t predict actual investment performance. Investments have no set rate of return per Investor.gov.
Can You Live Off Investment Income Alone?
The data shows that $1,000 a month can work as a mathematical income goal. It doesn’t establish that $1,000 a month can support a household’s full living expenses — particularly after taxes, fees, and inflation enter the picture.
A $300,000+ portfolio at a 7% annual rate produces the arithmetic equivalent of $12,000 per year. That’s $1,000 per month before taxes on dividends or capital gains, before investment fees, before inflation adjustments, and before accounting for any change in portfolio value itself.
Established financial research on sustainable retirement withdrawals generally points to a 4%–5% annual withdrawal rate over a 30-year horizon as a framework rather than a guarantee. That framework assumes specific portfolio compositions, time horizons, and confidence levels. It also specifically addresses a 30-year window — for much longer retirement periods, a lower initial rate may be appropriate to reduce the risk of outliving the portfolio.
The average S&P 500 dividend yield has historically run well below 4% — closer to 1%–2% in recent years. Relying entirely on dividends to hit a 4% income rate typically means concentrating in higher-yield assets, which carry their own risk profile. Investor.gov notes that higher potential returns generally involve higher risk.
💡 Realistic expectation from the data: The research points away from finding one magic investment amount. The more useful frame is understanding the relationship among portfolio size, contribution rate, return assumptions, taxes, fees, inflation, and withdrawal strategy — and then running those specific numbers through a calculator rather than relying on any headline figure.
The Bottom Line: 5-Step Investment Planning Checklist
What should you do right now if $1,000 a month from investments is your goal? Here’s what the Investor.gov, SEC, IRS, Federal Reserve, and BLS data actually supports:
1. Identify which number you’re actually solving for:
Dividend yield target, total return target, or safe withdrawal rate? A 4% dividend yield calculation gives $300,000+. A 10% historical total return gives $120,000. These are not interchangeable — be precise about which framework you’re using before setting a portfolio target.
2. Use the conservative 4% figure as your planning floor:
A $300,000+ portfolio at 4% is the most research-supported arithmetic benchmark for $12,000 annual income. Plans built on 6%+ income assumptions need an explicit acknowledgment that higher rates carry higher risk — and that those rates aren’t guaranteed.
3. Be honest about your contribution timeline:
A $250/month contribution takes 30+ years at 4% to reach $300,000+. If that doesn’t match your timeline, the contribution needs to increase. The accumulation table shows that moving from $500 to $1,000 per month saves roughly 7 years — a more controllable lever than trying to predict a higher return rate.
4. Account for taxes, fees, and inflation before spending projected income:
A $1,000 gross monthly figure from investments is not $1,000 net. Ordinary dividends face income tax. Fees reduce returns. Inflation at 3.4% per year erodes purchasing power. Use the IRS Topic 404 qualified-dividend thresholds to understand your tax position on investment income.
5. Run your personal numbers through the Investment Return Calculator:
A generic headline figure tells you less than your own starting balance, monthly contribution, and realistic return assumption run through SaveXpert’s Investment Return Calculator. That personalised result is more actionable than any single portfolio size from a published example.
I researched these figures from Investor.gov, the SEC, IRS, Federal Reserve, and BLS so everyday Americans can see the assumptions behind the number. No official U.S. source establishes one universal portfolio size for a $1,000 monthly target — and the range of arithmetic possibilities ($120,000 to $600,000) shows why the assumption matters as much as the goal.
“When I went through Investor.gov, the SEC materials, the Federal Reserve household data, and the IRS figures, the most important finding was a disconnect. People searching ‘how much to invest to make $1,000 a month’ usually have a specific number in mind. But the research shows that number changes entirely depending on whether you’re talking about dividend yield, total return, safe withdrawal rate, or actual after-tax cash income. Those four things are genuinely different — and the gap between them can be hundreds of thousands of dollars.”
— Kevin Brown, Lead Researcher at SaveXpert.com
Frequently Asked Questions
Ans: According to Investor.gov and SEC data, if you assume a 7% dividend yield, you need a $300,000+ portfolio to generate $1,000 a month. A 5% yield reduces the required portfolio size to $240,000. Dividend yields fluctuate and are never guaranteed by any investment — and the average S&P 500 dividend yield has historically been closer to 1%–2%, not 4%.
Ans: Timelines depend heavily on your monthly contributions. Assuming a 7% historical annual return — the lower end of the range cited by Investor.gov — investing $1,000 per month takes roughly 15 years to reach $300,000+. At $500 per month, the timeline extends to 21.9 years. At $250 per month, it stretches to 30.3 years.
Ans: According to Investor.gov, historical estimates for long-term, diversified U.S. stock market investments generally range between 7% and 10% annually. Official regulatory sources consistently emphasise that these historical averages don’t guarantee future performance or establish a fixed rate of return.
Ans: Using a standard 4% safe withdrawal framework, you would need a $300,000 portfolio to withdraw $1,000 a month ($12,000 annually). This approach assumes a 30-year timeframe and inflation adjustments, and treats the figure as a research guideline — not a guarantee. Market volatility, fees, and tax obligations can all affect sustainability.
Ans: It is mathematically possible if your portfolio is large enough, but according to Federal Reserve and IRS data, taxes, fees, and inflation will significantly reduce actual purchasing power over time. The BLS reported 3.4% annual CPI inflation through July 2026. A fixed $1,000 monthly target that doesn’t adjust for inflation buys less every year.
Ans: Total return includes both price appreciation and any income (dividends or interest) generated by the investment over a period. Income yield measures only the income component as a percentage of the investment’s value. Investor.gov and the SEC both note that a portfolio growing at 7%–10% annually does not automatically generate 7%–10% in spendable cash income each year — the growth may be largely or entirely in price appreciation, not distributions.