

ⓘ Educational Disclosure:
This article is for educational and informational purposes only. It does not constitute financial, legal, tax, lending, or investment advice. SaveXpert and its authors are not licensed financial advisors, CPAs, attorneys, or tax advisors. All data comes from publicly available government and institutional sources. Savings figures from cited research reflect averages and research findings — individual household results will vary based on actual spending, location, and household composition. Always verify current rates and figures at their official sources. Always consult a qualified professional before making investment decisions.
Can you deduct charitable donations without itemizing in 2026? Yes. Starting with tax years beginning after December 31, 2025, non-itemizers can claim a charitable deduction under Public Law 119-21, Section 70424. The maximum is $1,000 for taxpayers who don’t file jointly and $2,000 for married couples filing jointly. The deduction applies to qualifying cash contributions made to eligible tax-exempt organisations. IRS Topic 506 and the 2026 Form 1040-ES confirm both the amounts and the cash-only requirement. This provision is permanent — not a temporary pandemic-era measure. It’s a deduction that reduces taxable income, not a tax credit that reduces your tax bill dollar-for-dollar.
Key Takeaways
- Problem: Many American households struggle to find room in their budget because fixed bills — housing at $2,189/month, transportation at $1,110/month — consume most of the income. Looking for savings in the biggest bills first is the wrong place to start.
- Solution: The research points to discretionary categories — unused subscriptions, food away from home, and utility behaviour changes — as the areas with the most practical reduction potential. Bankrate’s analysis identifies meal prepping and canceling unused subscriptions as producing $100–$300/month in savings from small, stackable changes.
- Result: No single category covers $300/month on its own. The data consistently shows that reaching the target requires combining several smaller cuts across subscriptions, food, and utility behaviours — not one large lifestyle change.
- Source: BLS Consumer Expenditure Survey 2024 · Federal Reserve 2025 Economic Well-Being Report · Bankrate (private)
- Time To Read: 7 Minutes
Table of Contents
1. How Much the Average Household Spends Each Month
2. Where to Find Room to Cut Expenses
3. How Households Actually Respond to Financial Pressure
4. Testing the Numbers: What Getting to $300 Actually Requires
6. Realistic Expectations for Cutting $300 a Month
The easiest savings in a household budget aren’t usually found in the biggest bills. Housing averaged $2,189 per month for the typical US household in 2024. Transportation averaged $1,110. Both categories dominate the budget — and both are mostly fixed costs. The research I went through, including the BLS Consumer Expenditure Survey, Federal Reserve economic well-being data, and Energy Star efficiency studies, consistently points somewhere else: recurring smaller charges — subscriptions that go unnoticed, restaurant spending that doesn’t show up in memory the way rent does, and utility costs that move with behaviour rather than with a fixed contract.
How Much the Average Household Spends Each Month
The Bureau of Labor Statistics Consumer Expenditure Survey puts average annual household spending at $78,535 in 2024 — roughly $6,545 per month. Housing and transportation together account for approximately half of that total.
| Spending Category | Average Monthly Amount (2024) | Notes |
|---|---|---|
| Housing | $2,189 | Largest single category; largely fixed for renters and homeowners alike |
| Transportation | $1,110 | Includes vehicle payments, fuel, insurance, maintenance |
| Food (total) | $847 | Split between food at home and food away from home |
| Food at home | $519 | Groceries — influenced by meal planning and store choice |
| Food away from home | $329 | Restaurant meals, takeout — the more flexible food sub-category |
The split within food is the most useful data point in that table. Food at home and food away from home represent the same BLS category broken into two very different spending behaviours. Groceries respond to meal planning and store choice — both within a household’s control. Restaurant and takeout spending responds to choices that can change week to week without any fixed contract or lease.
Housing and transportation don’t work that way. You can’t renegotiate a lease or sell a car in a month to reach a $300 reduction target. The research points to these categories as the context for why the savings are elsewhere — not the source of the savings themselves.

Where to Find Room to Cut Expenses
Subscriptions: the category most households underestimate
CNET’s 2026 private research put average total subscription spending at $111 per month — $1,332 per year. The same research found $204 per year in unused subscription spending, or about $17 per month when spread across a year. Deloitte (private) reported average streaming spending of $69 per month across four services.
| Subscription Finding | Figure | Source |
|---|---|---|
| Average total monthly subscription spending | $111/month ($1,332/year) | CNET 2026 (private research) |
| Average unused subscription spending | $204/year (~$17/month) | CNET 2026 (private research) |
| Average streaming spending across 4 services | $69/month | Deloitte Digital Media Trends (private research) |
| Self-estimated monthly subscription spending | $86/month | CNET 2026 — the perception gap vs. actual $111 spending |
Source: CNET 2026 private research · Deloitte Digital Media Trends (private research). Neither is a federal figure.
The $17/month from unused subscriptions doesn’t reach $300 alone. But subscriptions are the fastest-acting category in a budget reduction effort: cancellations take effect within the current billing cycle, require no infrastructure change, and can be tracked exactly against a credit card statement. No estimate is needed — the charge either appears or it doesn’t.
Federal consumer-protection law also covers this area. The FTC’s Restore Online Shoppers’ Confidence Act (ROSCA) requires clear material terms, express informed consent before charging, and simple cancellation mechanisms for online negative-option transactions. One regulatory note worth flagging: the FTC’s 2024 Click-to-Cancel rule was vacated by the Eighth Circuit on procedural grounds in July 2025. The FTC restarted negative-option rulemaking through an ANPRM in March 2026. The consumer protection principles remain, but the specific rule implementing them is in a transitional state — check FTC.gov for current status.
Food away from home: a measurable $329/month category
The BLS data puts average food-away-from-home spending at $329/month. That’s the starting point — not an achievable savings target, but the size of the category a household is working with.
Private research from Bankrate identifies meal prepping as a direct reduction pathway within this category. The same Bankrate analysis that cites $100–$300/month in potential savings from small changes specifically includes meal preparation alongside subscription cancellations. A separate Bankrate finding notes that 37% of consumers reported dining out less in 2025 because of higher prices — showing that this category has already responded to financial pressure across a broad range of households without requiring a structured plan.
The research doesn’t provide a universal percentage reduction for food away from home. What it shows is the category’s size ($329/month average), its flexibility compared to housing or transportation, and the documented behaviour change — 37% of consumers already cutting — that confirms it responds to deliberate decisions.
Bankrate’s cited quick-win tactics (private analysis):
Turn off lights when not in the room; cancel rarely-watched streaming services; use GasBuddy to find lower fuel prices nearby; apply a 30-day waiting period to impulse purchases before buying. None of these require significant lifestyle overhaul — they’re individually small and cumulatively meaningful.
Utilities and phone bills
Average utility costs for electricity, gas, and water ran about $412/month in 2025, per the research brief. The average postpaid cell phone bill was $115/month.
| Energy Star Finding | Savings Estimate | Timeline |
|---|---|---|
| Whole-house efficiency solutions | 20%+ of utility bill (typical) | Long-term — depends on upgrades completed |
| Replacing 5 frequently used light fixtures with Energy Star bulbs | ~$40/year (~$3.30/month) | Next billing cycle after replacement |
| Replacing old heating/cooling equipment with certified units | ~$140/year (~$11.70/month) | Realised over the season after replacement |
| Sealing and insulating air ducts | Up to 10% HVAC efficiency improvement | Varies by home — requires professional assessment |
Source: Energy Star (US EPA). All figures are typical reported savings — actual results depend on equipment, housing conditions, and usage patterns.
Utility savings from behaviour changes — adjusting thermostat settings, running appliances off-peak, reducing standby power draw — can appear within a billing cycle. Equipment-based savings like the $140/year from certified heating and cooling units are real but longer-timeline. The research brief notes that phone and internet bill negotiation appears in general guidance but doesn’t provide a quantified typical saving from negotiation specifically. Average bill levels are established ($115/month for postpaid cell); what negotiation produces in a specific case isn’t established by the data.
Enter your income and top expenses to see where you stand.
How Households Actually Respond to Financial Pressure
The Federal Reserve’s 2025 economic well-being report — covering household experiences in 2024 — provides the clearest picture of what actually happens when households face budget pressure.
| Federal Reserve Finding | Share of Adults | Context |
|---|---|---|
| Cut back on other expenses (when struggling with bills) | 59% | Of adults who reported struggling with bills |
| Switched to cheaper products | 63% | Within the group that faced financial pressure |
| Used less of products or stopped using them | 61% | Within the group that faced financial pressure |
| Delayed purchases | 46% | Within the group that faced financial pressure |
| Always or often had money left over at month-end in 2025 | 41% | All adults surveyed — not just those under pressure |
Source: Federal Reserve 2025 Economic Well-Being of US Households
What’s notable about the Federal Reserve’s findings is their specificity. These aren’t aspirational savings strategies — they’re documented behaviour changes by actual households. Switching to cheaper products doesn’t require a new tool. Using less of something doesn’t require cancelling anything. Delaying purchases is a decision, not a system change. The research shows these are the changes that already happen at scale when budgets tighten.
One layer the research adds is the credit card dimension. The Federal Reserve G.19 reports the average credit card APR at 22.15% for Q2 2026, and the CFPB’s 2025 credit card market report found that average general-purpose credit card APRs reached 25.2% in 2024. A household carrying a balance while implementing budget cuts may find that interest charges erode a meaningful share of the gross savings — a $2,000 balance at 22.15% generates roughly $37 in monthly interest charges alone.

Testing the Numbers: What Getting to $300 Actually Requires
I ran a simple household scenario using the research figures to see what the data-supported categories actually add up to.
| Category | Research Finding | Potential Monthly Saving | Timeline |
|---|---|---|---|
| Unused subscriptions (average) | CNET: $204/year in unused subscription spending | ~$17/month | Next billing cycle |
| Additional subscription audit (streaming overlap, forgotten trials) | CNET: $111/month actual vs. $86/month perceived | Up to $25/month if audit closes the gap | Next billing cycle |
| Meal prepping (partial shift from food away from home) | Bankrate: part of $100–$300/month savings from small changes | Variable — proportional to current dining-out spending | Next month |
| Energy Star light fixture upgrade (5 fixtures) | ~$40/year | ~$3.30/month | Immediately after purchase |
| Certified heating/cooling equipment replacement | ~$140/year | ~$11.70/month | Season after installation |
| Behaviour-based utility reduction (thermostat, standby power) | Energy Star: up to 10% HVAC efficiency from duct sealing | Variable — depends on current bill and behaviour gap | Next billing cycle |
Source: CNET 2026 (private) · Bankrate (private) · Energy Star / US EPA. All savings are reported averages or ranges, not guaranteed individual outcomes.
The subscription categories together reach $17–$42/month depending on how thorough the audit is. Food away from home is the wild card — at $329/month average, even a 30% reduction in dining out produces about $99/month. Stacking those two categories with modest utility behaviour changes gets within range of the Bankrate $100–$300 target. No individual category delivers $300 on its own at the research-supported average level.
This is also where household-specific numbers matter more than national averages. A household spending $600/month on food away from home has a much larger reduction opportunity than one spending $150. The Budget Calculator below runs the analysis on your actual figures — not the BLS average.
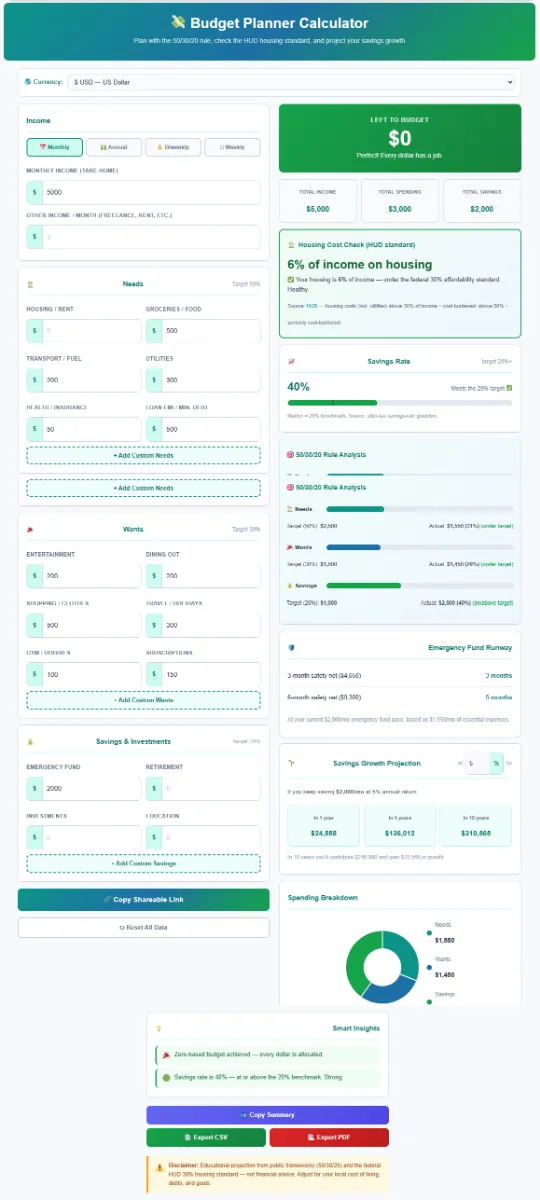
🧮 SaveXpert Budget Planner Calculator — Free & No Signup
Enter your actual monthly income and spending by category — not the BLS averages, your own numbers. The calculator shows where your spending sits relative to your income, identifies the categories with the largest share of discretionary spending, and models what a $100, $200, or $300 monthly reduction does to your available cash. Bankrate’s research specifically recommends reviewing the previous three months of actual expenses rather than estimating from memory — the calculator is built for exactly that input.
Educational note: Calculator models scenarios for informational purposes only. Source benchmarks: BLS Consumer Expenditure Survey · Federal Reserve Economic Well-Being Report
What the Research Shows Works
Target recurring discretionary spending before anything else.
The BLS data shows housing and transportation at over half of average household spending — both largely fixed. The research consistently points toward subscriptions, food away from home, and utility behaviour as the categories where a household can actually make a change in the next 30 days without renegotiating a lease or selling a car.
Audit subscriptions from bank statements, not from memory.
The CNET perception gap — $86 estimated vs. $111 actual monthly subscription spending — shows why memory is the wrong tool for this. The $204/year in unused subscription spending can’t be cut until it’s identified. Three months of bank and credit card statements reveal recurring charges that memory misses entirely. That audit is where the fastest savings usually surface.
Combine small changes across categories rather than searching for one large cut.
Bankrate’s $100–$300 range comes from combining meal prepping and subscription cancellations — not from one source. Federal Reserve data shows the same pattern in actual household behaviour: 63% switched to cheaper products, 61% used less, 46% delayed purchases. Multiple smaller decisions, applied consistently, produce the cumulative change. One large cut from a single category is harder to find and harder to sustain.
Track each category separately and on its own timeline.
Subscription cancellations show up on the next billing cycle. Food spending changes show up in the following month’s bank statement. Utility efficiency improvements — especially equipment-based ones like certified heating/cooling units — can take a full season to reflect in energy bills. The research shows timing depends on the category, which means a $300 monthly target may show up unevenly across the first several months rather than arriving as a clean $300 reduction all at once.
Keep credit card interest in the calculation.
A household carrying a balance at the Federal Reserve G.19’s 22.15% Q2 2026 average APR generates interest charges every month that reduce the net benefit of expense cuts. Cutting $300/month in gross spending while paying $50–$75/month in credit card interest produces a net improvement smaller than the headline number. The minimum payment research on SaveXpert covers exactly how that interest compounds when only minimum payments are being made.

Realistic Expectations for Cutting $300 a Month
The research doesn’t establish one universal formula that delivers $300 for every household. It shows that the target is within the range that’s been documented when several spending changes are combined.
Bankrate’s $100–$300 monthly range comes from specific small changes — meal preparation and subscription cancellations. It’s a range, not a guarantee, and the actual result depends on where a specific household’s spending currently sits relative to the BLS averages. A household already spending $50/month on food away from home has a much smaller reduction opportunity in that category than one spending $500.
Timing also varies by category:
| Category | Speed of Savings | Research Finding |
|---|---|---|
| Subscription cancellations | Next billing cycle | $17/month from average unused; up to $111/month for full audit |
| Reduced dining out / meal prepping | Following month | Up to $329/month available to reduce (BLS average category size) |
| Behaviour-based utility changes (thermostat, standby) | Next billing cycle | Energy Star: up to 10% from duct sealing; $40/year from light fixtures |
| Equipment upgrades (heating/cooling) | One season after installation | Energy Star: ~$140/year from certified equipment replacement |
Source: CNET 2026 (private) · BLS Consumer Expenditure Survey · Energy Star / US EPA
The Federal Reserve’s 50/30/20 framework — as cited in NerdWallet’s private analysis — divides after-tax income into 50% needs, 30% wants, and 20% savings or debt paydown beyond minimums. The framework itself doesn’t produce $300 in savings; it provides a structure for understanding which category any given spending belongs to and where the discretionary share sits. The Budget Calculator can map actual household spending against that structure.
Bottom Line: 5 Steps to Find $300 in Your Monthly Budget
1. Audit every recurring charge from the last 3 months of bank statements — not from memory:
Bankrate recommends reviewing actual expenses from the previous three months before building a reduction plan. CNET found the average American estimates $86 in monthly subscription spending but actually spends $111. That perception gap means self-reported estimates are unreliable inputs for budget planning. Pull three months of statements, list every recurring charge, and total the categories before deciding what to cut. The Budget Calculator is built for this input — actual figures, not estimates.
2. Cancel or pause subscriptions first — they’re the fastest-acting category:
The CNET $204/year figure in unused subscriptions works out to $17/month on average. Add a full subscription audit that closes the perception gap between estimated and actual spending, and the total can reach $25–$42/month in subscription-related savings alone. These changes take effect in the next billing cycle — no equipment purchase, no negotiation, no waiting period. The FTC’s ROSCA requires clear cancellation mechanisms for online negative-option transactions, so legitimate subscriptions must be cancellable. If you find one that isn’t, that’s worth reporting to the FTC.
3. Make food away from home your second target — it’s the largest flexible spending category in the BLS data:
At $329/month average, food away from home is the most flexible major spending category the BLS Consumer Expenditure Survey identifies. A 30% reduction in dining out for a household spending at the average produces about $99/month. Bankrate’s meal prepping recommendation is specifically tied to this category, not to grocery spending. The 37% of consumers who already cut dining out in 2025 because of higher prices show this category responds to deliberate decisions without requiring a permanent lifestyle change.
4. Add utility behaviour changes to the mix — track them quarterly, not monthly:
Energy Star’s light fixture upgrade produces ~$40/year and takes effect immediately after purchase. Certified heating/cooling equipment saves ~$140/year but reflects on the next seasonal bill. Behaviour changes — thermostat adjustment, reducing standby power — can start affecting the next cycle’s bill. Against a $412/month average utility bill, a 10–15% reduction from combined changes produces $41–$62/month. The important expectation to set: track utility savings quarterly, not monthly — the variation in billing cycles and seasonal usage means monthly comparisons can be misleading.
5. If you carry a credit card balance, run the Debt Payoff Calculator alongside the Budget Calculator:
The Federal Reserve G.19 puts the average credit card APR at 22.15% for Q2 2026. A $2,000 balance at that rate generates approximately $37 in monthly interest. A $5,000 balance generates around $92/month. Cutting $300/month in gross spending while paying $50–$92/month in interest produces a net improvement significantly smaller than the headline figure suggests. The research framework here is the same one the Federal Reserve economic data supports: addressing high-interest debt alongside expense cuts produces better net cash flow than expense cuts alone.
“The figure that recalibrated how I read all the other spending data was the subscription perception gap. CNET’s 2026 research found that the average American estimates their monthly subscription spending at $86 but actually spends $111. That’s a $25-per-month gap between what people think they’re spending and what they’re actually spending — and it exists before even looking at the $204 annual average in unused subscriptions. You can’t cancel a subscription you don’t know you’re paying for. That’s why subscription auditing appears at the top of every budget-reduction research trail I went through.”
— Kevin Brown, Lead Researcher at SaveXpert.com
Frequently Asked Questions
Ans: Bankrate (private) identifies unused digital subscriptions and food away from home as the most straightforward categories to reduce. The BLS puts average food-away-from-home spending at $329/month and CNET’s 2026 research found $204/year in unused subscription spending. Both categories share the same feature that makes them practical starting points: they’re recurring, measurable from a bank statement, and cancellable without a fixed-contract penalty. Neither requires renegotiating housing or transportation costs — the fixed categories that consume over half of average household spending per the BLS Consumer Expenditure Survey.
Ans: The Bureau of Labor Statistics Consumer Expenditure Survey puts average US household spending at $78,535 annually in 2024 — roughly $6,545 per month. Housing is the largest category at $2,189/month, followed by transportation at $1,110/month and food at $847/month. The food category splits into $519 at home and $329 away from home — the split that matters most for identifying where discretionary savings are actually available.
Ans: CNET’s 2026 private research found the average American wastes approximately $204 per year on unused subscriptions — about $17 per month. The same research identified average total subscription spending of $111/month against a self-estimate of $86/month. Closing the $25 perception gap through a thorough audit could add another $25/month in savings. Neither figure alone reaches a $300 monthly target, but subscription cuts are the fastest-acting category — they take effect within the current billing cycle without requiring negotiation or equipment purchase.
Ans: The research supports the size of these bills — average postpaid cell phone spending at $115/month — but does not establish a quantified typical saving from negotiation specifically. Industry sources like NerdWallet (private) provide general bill-reduction guidance, and consumers do report savings from asking providers for promotional rates or switching to cheaper plans. What the data doesn’t establish is a standard negotiation savings amount. The best approach is to compare your current plan against current competitor rates, confirm what your provider’s retention offers are, and calculate the switching cost before committing to a change.
Ans: The research points to combining multiple smaller cuts rather than finding a single large reduction. Bankrate’s analysis identifies $100–$300 monthly in savings from stacking meal prepping and subscription cancellations. Federal Reserve data shows the behaviour changes that actually happen at scale under financial pressure: 63% switched to cheaper products, 61% used less or stopped using certain products, and 46% delayed purchases. The fastest route to $300 in practice is: audit subscriptions from three months of statements (fast, one-time), reduce food-away-from-home spending for the next 30 days (fast, monthly), and add utility behaviour changes on top (fast for behaviour; slower for equipment upgrades). Running those through the Budget Calculator with actual figures shows how close that combination gets to the target.
Ans: By itself — not usually. The $17/month from average unused subscriptions won’t cover a $300 monthly reduction target. But CNET’s finding of $111/month in actual vs. $86/month estimated spending means the full subscription audit typically uncovers more than just the $17 in clearly unused charges — it surfaces forgotten trials, duplicated services, and plans that haven’t been evaluated since signup. Deloitte’s finding of $69/month in streaming spending alone shows that subscriptions as a category can exceed what most households realise. More practically: subscription cuts are the only budget-reduction category that can be implemented in a single afternoon, take effect in the same billing cycle, and require no ongoing behaviour change after the cancellation is done.