
ⓘ Educational Disclosure:
This article is for educational and informational purposes only. It does not constitute financial, legal, tax, lending, or investment advice. SaveXpert and its authors are not licensed financial advisors, CPAs, attorneys, or tax advisors. All data comes from publicly available government and institutional sources. Always consult a qualified professional before making investment decisions.
What is the average personal loan interest rate in 2026? As of Q2 2026, the Federal Reserve G.19 report shows an 11.86% average for 24-month personal loans from commercial banks — up from 11.36% in Q1 2026. Experian’s broader August 2026 data shows wider national averages: 13.67% for 36-month loans and 14.88% for 60-month loans. These figures reflect different lender populations. The full personal loan market runs from 5.96% to 35.99% APR, depending heavily on credit score, lender type, and loan term. A borrower with poor credit averages 25.82% APR; a borrower with exceptional credit averages 12.87% — on the same 36-month loan.
Key Takeaways
- Problem: Borrowers struggle to know whether a loan offer is fair because lenders advertise wildly different APRs for identical loan amounts — and because the “average” rate in headlines often comes from a narrow dataset that doesn’t reflect what most borrowers actually pay.
- Solution: The Federal Reserve G.19 benchmark for 24-month commercial bank personal loans stands at 11.86% for Q2 2026 — but Experian’s broader August 2026 data shows national averages of 13.67% (36-month) to 14.88% (60-month). Individual rates depend heavily on credit score and lender type.
- Result: Experian’s research shows comparing offers can save $233 to $425 in total interest on a $10,000 loan for borrowers with good-to-excellent credit. The 12.95 percentage-point gap between poor and exceptional credit shows the stakes are high for score management.
- Source: Federal Reserve G.19 Consumer Credit (Aug 7, 2026), Experian August 2026 Consumer Credit Data
- Time To Read: 7 Minutes
Table of Contents
1. Why the “Average” Personal Loan Rate Can Mislead Borrowers
2. How Credit Score Changes the Rate You Actually Receive
3. What the Federal Reserve G.19 Data Shows for 2026
4. How Loan Term Affects Your APR and Total Interest Cost
5. How to Compare Personal Loan Offers Without Hurting Your Credit Score
6. Secured vs. Unsecured Loans: What the Research Does and Doesn’t Show
7. What the Research Shows Works (and What Doesn’t)
8. What Borrowers Can Realistically Expect in 2026
9. Bottom Line: 5 Steps to Find the Best Personal Loan Rate in 2026
The most surprising number I found in the Federal Reserve rate data wasn’t the benchmark itself. It was the range. The personal loan market in 2026 runs from 5.96% to 35.99% APR across lenders — a 30-percentage-point spread on what is ostensibly the same product. The Federal Reserve’s Q2 2026 G.19 benchmark of 11.86% for 24-month commercial bank loans sits somewhere in the middle of that range. What matters is where your offer sits.
Why the “Average” Personal Loan Rate Can Mislead Borrowers
The problem with headline averages isn’t that they’re wrong — it’s that they’re measuring something specific that often doesn’t match what an individual borrower will see.
The Federal Reserve tracks rates charged by reporting commercial banks during the first calendar week of the middle month of each quarter. Its 11.86% Q2 2026 figure represents a specific commercial-bank sample. Experian’s data covers a broader national lending population — which is why its August 2026 averages (13.67% for 36 months, 14.88% for 60 months) come in higher.
Then there’s the lender-type dimension. Research from RateAPI.dev shows credit union personal loan APRs ranging from 1.000% to 28.000%. Both figures are real — they reflect different member populations, underwriting criteria, and lending missions. A borrower who only checks one source is seeing one slice of a much wider market.
Consider two borrowers looking for the same $10,000 loan. One receives a commercial bank quote near the Federal Reserve benchmark. Another checks an online lender that uses different underwriting criteria entirely. The two offers can differ substantially — and both can be “the rate” for their respective markets.
💡 Research note: The full personal loan market runs from 5.96% to 35.99% APR across lenders in 2026, per Experian data. The Federal Reserve’s 11.86% sits in the better half of that range — but it reflects commercial banks, not the full market. Checking multiple sources gives a more accurate picture of where any individual offer stands.
How Credit Score Changes the Rate You Actually Receive
The strongest pattern across all the research is the credit score relationship. It’s not marginal — it’s a 12.95 percentage-point spread between the worst and best credit tiers on the same loan type.
Experian’s data on 36-month personal loan APRs by credit tier shows the full picture:
| FICO Score Range | Credit Tier | Average APR (36-Month, Experian Aug 2026) |
|---|---|---|
| 300–579 | Poor / Bad | 25.82% |
| 580–619 | Fair (example: FICO 620) | 18.52% |
| 700–739 | Good (example: FICO 740) | 11.10% |
| 800–850 | Exceptional | 12.87% median · 11.77% minimum |
Source: Experian Consumer Credit Data, August 2026 · Federal Reserve G.19
What the gap means in dollars
A borrower at FICO 620 and a borrower at FICO 740 see an 18.52% versus 11.10% average APR on a 36-month loan — a 7.42 percentage-point difference. Extend to the full poor-to-exceptional spread, and the gap reaches 12.95 percentage points.
On a $10,000 loan at 25.82% over 36 months, total interest exceeds $4,400. On the same loan at 12.87%, total interest runs closer to $2,100. That’s more than $2,000 in additional cost driven entirely by credit score — before any other variable changes.
One detail in the Experian data is worth noting separately. For borrowers with FICO scores between 800 and 850, Experian shows both a 12.87% median APR and an 11.77% minimum APR. The median and the minimum are different measures — and the spread between them shows that even within the exceptional tier, shopping matters.
⚠️ The research doesn’t support the idea that credit score barely matters: The actual Experian figures show otherwise. A 7.42 percentage-point difference between FICO 620 and FICO 740, and a 12.95 percentage-point difference between poor and exceptional credit, represent thousands of dollars over a loan term — not rounding errors.
What the Federal Reserve G.19 Data Shows for 2026
I spent time going through the Federal Reserve’s G.19 releases specifically because they’re the primary official benchmark for personal loan rates in government reporting. Here’s what the quarterly trend shows:
| Period | 24-Month Commercial Bank Personal Loan Rate | Change |
|---|---|---|
| 2021 (baseline) | 9.38% | — |
| Q2 2025 | 11.50% | +2.12pp from 2021 |
| Q4 2025 | 11.63% | +0.13pp from Q2 2025 |
| Q1 2026 | 11.36% | –0.27pp from Q4 2025 |
| Q2 2026 | 11.86% | +0.50pp from Q1 2026 |
Source: Federal Reserve G.19 Consumer Credit — released August 7, 2026 (preliminary, subject to revision)
The Q2 2026 rate of 11.86% represents a 0.50 percentage point increase from Q1 2026 and a 0.36 percentage point increase from Q2 2025. It remains well above the 9.38% baseline from 2021 — a 2.48 percentage point increase over five years.
The Federal Reserve also reported that total consumer credit outstanding reached $5.17 trillion in Q2 2026. Revolving credit grew at a 3.9% annual rate, while nonrevolving credit — which includes personal installment loans — grew at 2.1%.
💡 Research note: The Federal Reserve’s G.19 data is described as “preliminary and subject to revision” at release. The report measures rates charged during the first calendar week of the middle month of each quarter — not the rate available to every borrower on any given day. It’s a benchmark, not a quote. The August 7, 2026 release covers Q2 2026 (April–June) activity.
What the Federal Reserve rate relationship actually tells us
A common question is how the Federal Reserve’s policy rate connects to personal loan APRs. The G.19 data shows commercial bank rates moving in a generally similar direction to broader rate environments. But the research brief doesn’t provide a specific pass-through formula for individual lenders.
What the data does establish is a reliable market benchmark. When a lender quotes you 17% on a 24-month loan in 2026, you know that sits roughly 5 percentage points above the commercial bank average. When a lender quotes 9%, you know you’re well below benchmark. The comparison only works if you know what the benchmark is.
Compare two loans side-by-side to find the cheaper option.
How Loan Term Affects Your APR and Total Interest Cost
Here’s the counterintuitive finding. Shorter loan terms don’t automatically mean lower APRs.
Experian’s August 2026 data shows the 36-month average APR at 13.67%. The 60-month average comes in higher at 14.88%. The research attributes this to reduced lender risk from faster repayment — a shorter term means the lender gets paid back sooner and faces less uncertainty, which they reflect in the rate.
| Loan Structure | Avg APR (Experian Aug 2026) | Example: $10,000 Loan — Total Interest |
|---|---|---|
| 24 months (commercial bank) | 11.86% (Fed Reserve benchmark) | ~$1,263 |
| 36 months | 13.67% | ~$2,217 (at 13.5%) |
| 60 months | 14.88% | ~$4,274 (at 15%) |
Source: Federal Reserve G.19 · Experian August 2026 · Research brief calculations
The 60-month loan produces roughly $2,057 more in total interest than the 36-month loan in this example — even though the 60-month monthly payment is lower. A lower monthly payment and a lower total cost are not the same thing. This distinction shows up repeatedly in borrower confusion over loan terms.
⚠️ Monthly payment vs. total cost: Extending a loan term reduces the monthly payment but raises both the APR and the total interest paid. The research supports comparing the full repayment amount — not just the monthly figure — before choosing a term length.

How to Compare Personal Loan Offers Without Hurting Your Credit Score
The research brief specifically recommends comparing multiple offers because APRs can vary by more than 30 percentage points across lenders. Experian’s research estimates potential interest savings of $233 to $425 on a $10,000 loan for borrowers with good-to-exceptional credit who compare offers.
This is where the credit inquiry question comes in. Many borrowers avoid comparing offers because they’re worried about multiple hard inquiries hurting their score. The research brief highlights that this concern can leave borrowers accepting higher APRs than they need to — but the data on specific inquiry policies varies by lender. Pre-qualification with soft inquiries is widely available and doesn’t affect scores.
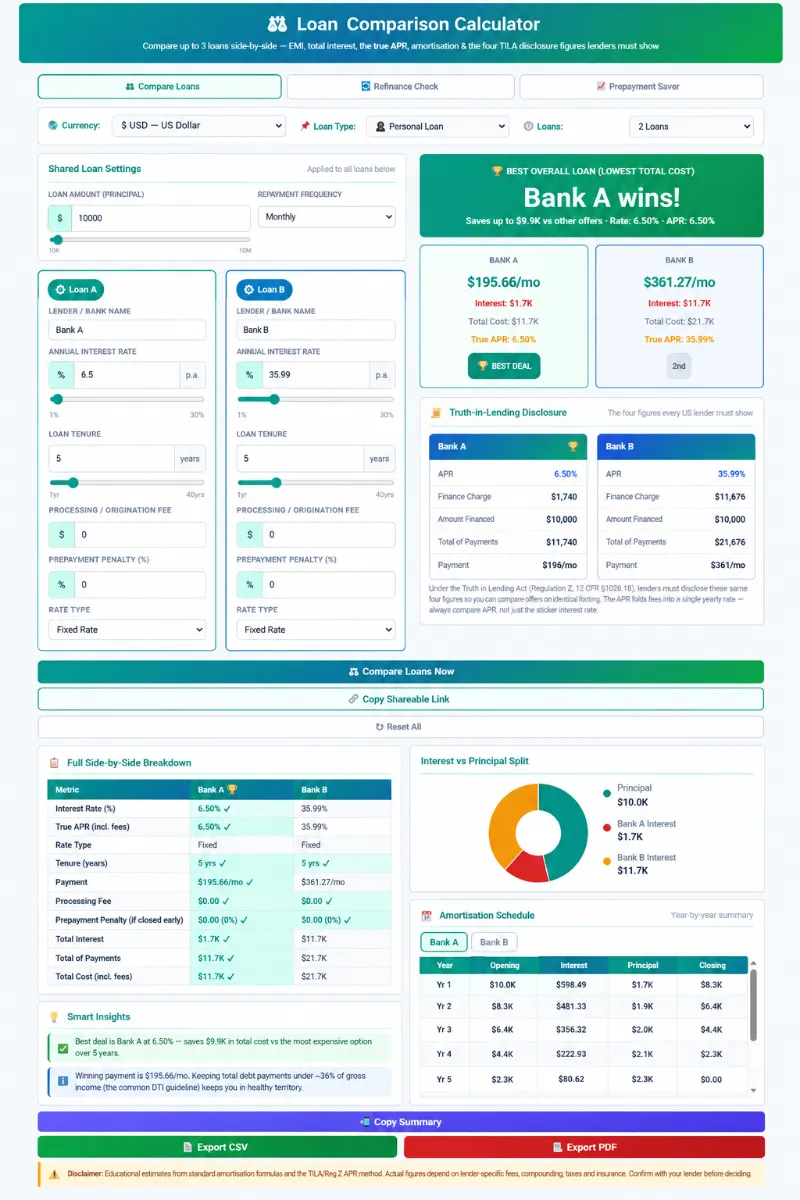
The comparison that actually matters isn’t rate alone. It’s the total repayment amount across all terms and fees — which is why the Loan Comparison Calculator is more useful than comparing percentage points in isolation.
💰 Compare the Full Cost: SaveXpert Loan Comparison Calculator
I ran the Federal Reserve benchmark (6.5%) against Experian’s 60-month average (35.99%) through the Loan Comparison Calculator on a $10,000 loan. The total interest difference came to more than $1,600 over the loan term — on two offers that don’t look dramatically different as headline percentages. The calculator makes the dollar difference visible before you sign, not after. Put your own offers side by side.
Educational note: This calculator models loan cost scenarios for informational purposes only and does not provide personalized financial advice. Source: Federal Reserve G.19 Consumer Credit
Secured vs. Unsecured Loans: What the Research Does and Doesn’t Show
The research brief covers personal loan rates primarily through the lens of unsecured lending — where no collateral backs the loan, and the borrower’s creditworthiness drives the rate. The Federal Reserve’s G.19 series and Experian’s consumer credit data both track unsecured personal loan rates in the figures cited above.
The research brief doesn’t provide a direct rate comparison between secured and unsecured personal loan products. Secured personal loans — backed by assets like a savings account or vehicle — generally carry different risk profiles for lenders, which affects pricing. But without data establishing specific rate comparisons, the research doesn’t support a definitive claim about which type consistently carries a lower APR in 2026.
The Regulation Z disclosure your lender must provide
One area where the research is specific: the Truth in Lending Act and Regulation Z require lenders to disclose the APR, finance charges, and total repayment amount for consumer credit transactions of $73,400 or less (the 2026 Regulation Z threshold). That threshold is a disclosure requirement — not a maximum loan amount — but it means every personal loan offer at or below that level comes with legally required, standardised cost disclosure.
The CFPB defines finance charges as including interest plus fees payable directly or indirectly as part of extending credit. That definition matters when comparing offers — a lower advertised rate that includes high origination fees may cost more than a higher rate with no fees when the total finance charge is calculated.
💡 Research note: When comparing personal loan offers, the Regulation Z disclosure gives you the APR (which incorporates fees into the rate), the total finance charge, and the total repayment amount. Comparing APRs rather than nominal interest rates is more accurate precisely because APR includes the fees that a nominal rate omits.
What the Research Shows Works (and What Doesn’t)
What the data consistently supports
Knowing the Federal Reserve benchmark before approaching any lender.
The gap between the 28% who had a strict gift budget and the 80% who planned to use “some budgeting strategy” is the clearest finding in the holiday-spending research. A specific number — not a general intention — produces the boundary that prevents overspending from becoming post-holiday revolving debt.
Prioritising credit score before applying.
The 12.95 percentage-point spread between poor and exceptional credit in the Experian data is the largest single variable in the rate equation. A borrower who improves a FICO score from 620 to 740 before applying moves from an 18.52% average to 11.10% — a difference of $1,167 in total interest on a $10,000 36-month loan.
Comparing multiple offers — including term lengths — before accepting.
Experian’s research estimates $233 to $425 in potential savings from offer comparison on a $10,000 loan for good-to-exceptional credit borrowers. The Loan Comparison Calculator converts those savings from percentage points into actual dollars, which makes the comparison’s value concrete.
Reading the Regulation Z disclosure rather than just the rate headline.
The APR, finance charge, and total repayment amount are legally required disclosures for personal loans up to $73,400. Those three numbers together give a complete cost picture that a headline rate alone doesn’t provide.
What the data says doesn’t work
Accepting the first offer without comparison.
The research shows that APRs can vary by more than 30 percentage points across lenders. The first offer isn’t a market-clearing price — it’s one lender’s pricing. Experian’s data quantifies the cost of skipping the comparison step.
Choosing a longer term only to lower the monthly payment.
The Experian data shows 60-month loans averaging 1.21 percentage points higher APR than 36-month loans — plus significantly more total interest over the repayment period. The $2,057 additional interest in the $10,000 example is real money lost to term extension alone.
Assuming all personal loan averages come from the same dataset.
The Federal Reserve’s 11.86% covers commercial banks. Experian’s 13.67-14.88% covers a broader lender population. Both are accurate; neither is the single “true” average. A borrower who relies on one figure to judge all offers will misread some of them.

What Borrowers Can Realistically Expect in 2026
The research supports a clear framing: personal loan pricing is highly individualised. The Federal Reserve’s 11.86% benchmark and Experian’s broader averages give context — not guarantees.
A borrower with exceptional credit (800+) applying to a commercial bank in Q2 2026 might see an offer near the Federal Reserve benchmark or the Experian minimum (11.77%). A borrower at 620 FICO applying to a broader online lender market should expect something closer to Experian’s 18.52% average for that tier — and possibly higher for longer terms.
The credit union range (1.000% to 28.000% per RateAPI.dev) shows why lender type matters as much as credit score. Credit union membership and underwriting vary significantly from commercial banks and online lenders. The range itself confirms there’s no single rate that reflects “what personal loans cost.”
The Q2 2026 Federal Reserve figures carry a “preliminary, subject to revision” note — they were released August 7, 2026. The most recent available data is from Q2 (April–June). Real-time rate movements between release dates won’t be captured in the G.19 figures until the next quarterly release.
Bottom Line: 5 Steps to Find the Best Personal Loan Rate in 2026
1. Use the Federal Reserve G.19 benchmark as your calibration point — not your expected rate:
The Q2 2026 commercial bank average is 11.86% for 24-month loans. That tells you what the commercial bank tier looks like. An offer above 15% on a 24-month loan from a bank is pricing in significant risk. An offer at 9% means you’re below the benchmark — worth understanding why before you sign.
2. Know your credit score before approaching any lender:
The Experian data shows a 12.95 percentage-point spread between poor and exceptional credit on 36-month loans. Knowing your score tells you which part of the Experian rate bands to expect — before a hard inquiry lands on your file. If your score is near a tier boundary, improving it before applying can produce a meaningfully better rate.
3. Compare at least 3 lenders before accepting any offer:
Experian’s research shows $233 to $425 in potential interest savings on a $10,000 loan just from comparison shopping for good-to-exceptional credit borrowers. Pre-qualification soft inquiries let you see estimated rates without affecting your credit score. The Loan Comparison Calculator converts those percentage differences into total-dollar comparisons.
4. Compare total repayment — not just the monthly payment or the nominal rate:
The research shows a 60-month loan can carry both a higher APR and $2,057 more in total interest than the 36-month version of the same loan. Read the Regulation Z disclosure: the APR, finance charge, and total repayment amount give the full cost picture. A lower monthly payment is not the same as a lower total cost.
5. Don’t assume one average describes your market:
The Federal Reserve tracks commercial banks; Experian tracks a broader national population; credit unions run a different range entirely (1% to 28%). When researching personal loan rates, check multiple datasets — the Federal Reserve G.19 for the benchmark, Experian for broader credit-tier context, and your specific lender’s Regulation Z disclosure for the actual offer on your table.
“When I went through the Federal Reserve’s G.19 release and cross-referenced it with Experian’s August 2026 rate data, the number that stood out isn’t the benchmark — it’s the credit-score spread. There’s a 12.95 percentage-point gap between poor and exceptional credit on 36-month personal loan rates. On a $10,000 loan, that gap translates to more than $2,000 in total interest over the loan term. The national average doesn’t tell you which end of that spread you’re on.”
— Kevin Brown, Lead Researcher at SaveXpert.com
Frequently Asked Questions
Ans: As of Q2 2026, the Federal Reserve G.19 report shows 11.86% for 24-month personal loans from commercial banks. That figure was released on August 7, 2026, as preliminary and is subject to revision. Experian’s broader August 2026 data shows national averages of 13.67% for 36-month loans and 14.88% for 60-month loans. These reflect different lender populations. The full market range runs from 5.96% to 35.99% APR depending on credit score, lender type, and term.
Ans: Experian’s August 2026 data shows borrowers with FICO scores between 800 and 850 averaging a 12.87% median APR and an 11.77% minimum APR on 36-month personal loans. No single score guarantees a specific rate — individual lender underwriting criteria vary. But the research establishes a clear relationship: higher credit scores consistently produce lower average APRs across the Experian dataset, with the spread reaching 12.95 percentage points between poor and exceptional credit tiers.
Ans: The Federal Reserve’s G.19 data shows commercial bank personal loan rates moving in a broadly similar direction to the wider rate environment — rising from 9.38% in 2021 to 11.86% in Q2 2026. The research brief doesn’t provide a specific pass-through formula showing exactly how a Federal Reserve policy rate change translates to a personal loan APR for any individual borrower. What the data establishes is a market benchmark that individual offers can be measured against.
Ans: The Experian data shows 36-month loans averaging 13.67% APR versus 14.88% for 60-month loans — meaning shorter terms actually carry lower average rates. On a $10,000 loan, the research’s example shows approximately $2,217 in total interest for 36 months versus approximately $4,274 for 60 months — a difference of roughly $2,057. The longer term produces a lower monthly payment but a higher total cost. The research supports choosing the shorter term when the monthly payment is manageable.
Ans: The Federal Reserve and CFPB data don’t establish a universal maximum loan amount set by law — individual lenders set their own limits. The relevant 2026 regulatory figure is the Regulation Z disclosure threshold of $73,400, which determines when Truth in Lending Act disclosure requirements apply. That’s a disclosure trigger — not a lending ceiling. Lenders can and do originate personal loans above $73,400; those transactions just face different disclosure rules under TILA.
Ans: The Federal Reserve G.19 tracks rates charged by reporting commercial banks during the first calendar week of the middle month of each quarter. This is a specific measurement of a specific lender sample. Online lenders, credit unions, and fintech platforms aren’t all captured in that sample — which is why Experian’s broader national data shows averages 1.8 to 3 percentage points higher than the Federal Reserve benchmark. Both datasets are accurate; they’re measuring different segments of the lending market. Checking both gives a more complete picture than relying on either alone.