
ⓘ Educational Disclosure:
This article is for educational and informational purposes only. It does not constitute financial, legal, tax, lending, or investment advice. SaveXpert and its authors are not licensed financial advisors, CPAs, attorneys, or tax advisors. All data comes from publicly available government and institutional sources. Always consult a qualified professional before making investment decisions.
How much house can I afford in 2026? The research shows two federal benchmarks. HUD recommends keeping total housing costs — mortgage, property taxes, insurance, and utilities — below 30% of gross household income. Households above that level are classified as cost-burdened; above 50% as severely cost-burdened. The CFPB’s Qualified Mortgage framework sets a separate ceiling: total monthly debt (including housing costs plus all other debts) at 43% of gross income for loan qualification. Lenders can therefore approve a borrower for a payment that exceeds the HUD affordability standard. Those two benchmarks — 30% for housing costs and 43% for total debt — define the real answer to “how much house can I afford in 2026.”
Key Takeaways
- Problem: Buyers are confused by the gap between what housing policy considers “affordable” and what mortgage lenders will actually approve — they’re different standards set by different federal agencies.
- Solution: HUD considers a household cost-burdened when housing costs exceed 30% of gross income. The CFPB’s Qualified Mortgage rule allows lenders to approve borrowers up to a 43% total debt-to-income ratio. A lender can legally qualify you for a payment that exceeds the federal affordability standard.
- Result: Understanding both thresholds — 30% for affordability, 43% for qualification — gives buyers a more honest picture of how much house they can comfortably carry vs. how much a lender may approve.
- Source: HUD Affordability Framework, CFPB Qualified Mortgage Rules, FHFA 2026 Loan Limits
- Time To Read: 6 Minutes
Table of Contents
1. Affordable vs. Qualifiable: The Two Numbers That Matter Most
2. What Percentage of Income Should Go Toward Housing Costs?
3. How Much Do You Need for a Down Payment in 2026?
4. What DTI Ratio Do Lenders Look For in 2026?
5. How Student Loan Debt Affects the Calculation
6. How to Calculate How Much Mortgage You Can Qualify For
7. The 2026 Loan Limits That Cap Program Eligibility
8. What the Research Shows Works (and What Doesn’t)
9. Realistic Expectations for 2026 Home Buyers
10. Bottom Line: 5 Steps to Figure Out How Much House You Can Afford
There are two answers to “how much house can I afford in 2026?” — and they come from different federal agencies with different purposes. HUD’s housing affordability framework points to 30% of gross income for total housing costs. The CFPB’s Qualified Mortgage rule allows lenders to approve borrowers up to a 43% total debt-to-income ratio. A lender can legally qualify you for a payment that exceeds the federal housing standard for affordability. Most buyers don’t realise those are separate questions with different answers.
Affordable vs. Qualifiable: The Two Numbers That Matter Most
The single most important finding in the research is the gap between two federal standards that rarely get discussed together.
| Standard | Threshold | What It Covers | Set By |
|---|---|---|---|
| HUD affordability benchmark | 30% of gross income | Total housing costs: mortgage + taxes + insurance + utilities | HUD housing policy |
| Cost-burdened threshold | >30% of gross income | Household spending more than the affordable standard on housing | HUD |
| Severely cost-burdened | >50% of gross income | Household spending more than half of income on housing | HUD |
| CFPB Qualified Mortgage DTI ceiling | 43% of gross income | Total monthly debt obligations including housing | CFPB (original QM rule) |
| Conventional guideline (28/36 rule) | 28% housing / 36% total | Underwriting guidance, not a federal requirement | Conventional lending practice |
Source: HUD Affordability Framework · CFPB Qualified Mortgage Rule
The difference matters more than it looks. A household earning $100,000 gross has a 30% HUD affordability ceiling of $2,500/month for all housing costs combined. The CFPB’s 43% DTI ceiling lets a lender consider up to $3,583/month in total monthly debt — including housing plus car payments, student loans, credit cards, and anything else.
Those aren’t the same question. A lender working off the 43% ceiling can legally approve a monthly housing payment that HUD’s framework would classify as cost-burdened. The buyer is the one who has to decide which standard matters more to their household budget.
What Percentage of Income Should Go Toward Housing Costs?
The federal affordability benchmark is 30% of gross household income — meaning pre-tax income, not take-home pay. That distinction is more important than it first appears.
Consider a household with $100,000 in gross annual income. Thirty percent of gross income is $30,000 per year, or $2,500 per month. But gross income isn’t what hits the bank account. After federal income taxes, state income taxes, Social Security and Medicare contributions, and other deductions, the actual take-home pay may be $6,000–$6,500/month or less. A $2,500 housing cost is 30% of gross — but it’s closer to 38–42% of actual take-home pay.
That’s why the research flags the gross-income detail as critically important. Online affordability tools that use gross income can show a higher affordable payment than feels realistic when the buyer maps it against their actual monthly cash flow.
The HUD framework’s 30% also covers more than the mortgage. The 30% includes mortgage principal and interest, property taxes, homeowner’s insurance, and utilities. A household whose mortgage P&I alone equals 30% of gross income is likely spending well above the federal standard once taxes, insurance, and utilities are added.
⚠️ The 30% applies to all housing costs — not just the mortgage payment: Suppose property taxes and insurance add $600/month, and utilities add $200/month. At 30% of gross, the remaining budget for mortgage P&I is $1,700 — not $2,500. That’s the number to plug into the mortgage calculator, not the gross 30% figure.
The research also notes that roughly 50% of renters already spend more than 30% of income on housing — pointing to a broader affordability problem that precedes any mortgage decision.
How Much Do You Need for a Down Payment in 2026?
The 20% figure isn’t a universal requirement — and the NAR data from 2025 makes that clear.
| Buyer Type | Median Down Payment (NAR 2025) | Notes |
|---|---|---|
| First-time buyers | 10% | Lowest since tracking began for this group |
| All buyers (median) | 19% | Closer to the “20% standard” — but not universal |
| FHA financing minimum | 3.5% | Subject to FHA qualification requirements |
| PMI avoidance threshold | 20% | Avoids private mortgage insurance; not a legal requirement |
The 20% threshold relates specifically to PMI — not to qualification itself. Lenders don’t require 20% down; they require PMI if you put less than 20% down (on most conventional loans). That PMI cost adds to the monthly housing expense and should factor into the 30% HUD affordability calculation.
The NAR also reported that first-time buyers now represent just 21% of all buyers — the lowest share recorded since 1981 — with a median age of 40. The picture of the “first-time buyer” has changed substantially from the traditional 20s-to-30s demographic the term once implied.
What DTI Ratio Do Lenders Look For in 2026?
The research identifies 43% total DTI as the ceiling associated with the CFPB’s original Qualified Mortgage rule. That’s total monthly debt obligations — housing costs plus all other recurring monthly debts — divided by gross monthly income.
The DTI calculation is the lender’s question. The HUD 30% is the affordability question. They’re measuring different things.
Why the 43% ceiling can still produce cost-burdened households
Suppose a household earns $8,000/month gross and has $1,200/month in non-housing debt (student loans, car payment, credit cards). The 43% QM ceiling allows up to $3,440/month in total monthly debt. Subtracting existing obligations leaves $2,240 available for housing costs. At 30% of $8,000 gross, the HUD affordability ceiling for housing is $2,400/month.
In this scenario, the lender’s DTI limit and the HUD affordability standard produce similar results. But with higher existing debt, the DTI math leaves less room — and the 43% ceiling doesn’t expand to compensate. Conversely, a household with minimal existing debt could qualify for a housing payment that exceeds the HUD affordability standard, since 43% total DTI with minimal other obligations leaves almost 43% available for housing alone.
The research also notes that some borrowers with larger down payments and stronger credit profiles can sustain DTI levels up to 45% with certain lenders — not as a universal federal rule, but as an observed lending outcome. It also states that borrowers approaching or exceeding 43% DTI face higher default probability in CFPB analysis.
💡 Research note: The 28/36 rule — where housing costs stay below 28% of gross income and total debt below 36% — is a conventional underwriting guideline, not a federal requirement. It’s more conservative than the CFPB’s 43% QM ceiling. Different calculators use different rules, which is why they produce different answers for the same household.
Estimate your monthly payment and total interest in seconds.
How Student Loan Debt Affects the Calculation
The research doesn’t provide a separate 2026 student-loan threshold or a specific formula for how lenders treat different types of student debt. What it does establish is the framework within which student loan payments operate.
Student loan payments count as monthly debt obligations in the DTI calculation. A borrower with $400/month in student loan payments and $300/month in a car payment carries $700/month in non-housing debt before the mortgage is considered. Against a 43% DTI ceiling on $7,000/month gross income ($3,010 total allowable), that leaves $2,310 for housing costs.
The research explicitly warns against inserting specific student-loan formulas that the available data doesn’t support. The broader framework is clear: every dollar of monthly debt obligation reduces the mortgage payment a lender can approve while staying within the DTI limits.
That makes existing debt — any type of monthly obligation — one of the most important variables in the affordability calculation. Income and debt together determine the mortgage envelope, not income alone.

How to Calculate How Much Mortgage You Can Qualify For
The research points to four inputs that determine the answer: household gross income, existing monthly debt obligations, down payment, and interest rate. No single multiplier replaces that calculation.
The research brief notes 30-year fixed mortgage rates of approximately 6.48%–6.65% from June 2026 data. The federal funds rate as of September 8, 2026 stood at 4.75% — but as with the mortgage rate article, the research clarifies that 30-year mortgage rates track longer-term Treasury yields and investor inflation expectations rather than moving directly with the federal funds rate.
A practical walkthrough using the research data:
| Variable | Example Household | Notes |
|---|---|---|
| Gross monthly income | $8,000/month ($96K/year) | Pre-tax income used in all DTI calculations |
| HUD 30% housing ceiling | $2,400/month (all housing costs) | Mortgage + taxes + insurance + utilities |
| Taxes, insurance, utilities (estimate) | $750/month | Highly location-dependent |
| Available for mortgage P&I | ~$1,650/month | Within HUD 30% standard |
| Approximate loan at 6.65%, 30-year | ~$256,000 | Based on $1,650/month P&I at 6.65% |
| CFPB 43% DTI ceiling (total) | $3,440/month | All monthly debts combined |
| Existing monthly debts | $600/month | Student loans, car, credit card minimums |
| Available for mortgage under DTI | $2,840/month | What a lender may approve |
| Approximate loan at 6.65%, 30-year (DTI) | ~$441,000 | Higher than the HUD-affordable figure |
Illustrative calculations using research data. Source: HUD 30% standard · CFPB QM Rule
The gap between $256,000 (what the HUD 30% standard supports for the mortgage itself) and $441,000 (what the CFPB DTI ceiling may approve) is where the “affordable vs. qualifiable” gap lives in practice. A lender can approve the higher figure. Federal housing policy considers the household that takes it cost-burdened.
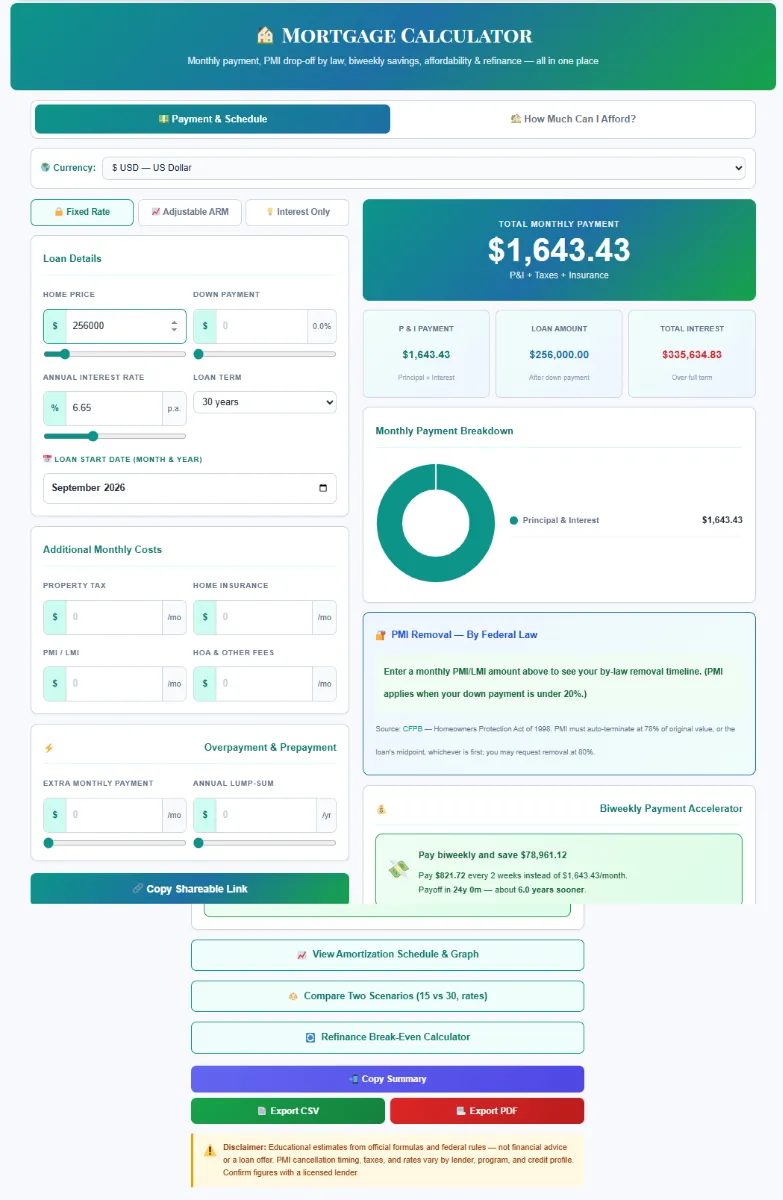
🏠 Run Your Own Scenarios: SaveXpert Mortgage Calculator
I ran the HUD-affordable scenario ($1,643.43/month P&I at 6.65%) and the CFPB-approvable scenario ($2,831.07/month P&I) through the Mortgage Calculator. The resulting loan amounts — $256,000 vs. $441,000 — illustrate exactly how much the gap between affordability and qualification matters in practice. Put your own income, existing debts, down payment, and rate in. The calculator converts the percentage frameworks into actual monthly dollars before you talk to a lender.
Educational note: This calculator models payment scenarios for informational purposes only and does not provide personalized mortgage or financial advice. Source: HUD Affordability Framework · CFPB QM Rules
The 2026 Loan Limits That Cap Program Eligibility
Affordability math and DTI ratios establish what a household can handle. Loan limits establish the maximum loan amount a particular program will finance. They’re ceilings, not recommendations.
| Program | 2026 Baseline (1-unit) | 2026 High-Cost Ceiling (1-unit) | Change from 2025 |
|---|---|---|---|
| Conventional (FHFA conforming) | $832,750 | $1,249,125 | +$26,250 from 2025 baseline |
| FHA | $541,287 (floor) | $1,249,125 | Up from $524,225 floor in 2025 |
Source: FHFA 2026 Conforming Loan Limits · FHA 2026 Mortgage Limits
A buyer targeting a home priced above the conforming baseline in a standard-cost area will likely need a jumbo loan — which carries different underwriting standards and often different pricing than conforming loans. In high-cost areas, the higher ceiling applies, which is why the limits vary by geography.
The research also notes two additional data points relevant to 2026 buyers. For post-2017 mortgage debt, the IRS mortgage interest deduction is limited to acquisition debt of $750,000 or less (with a grandfathered $1 million limit for debt originated before December 15, 2017). And the Federal Reserve established a $34,200 higher-priced mortgage appraisal threshold effective January 1, 2026 — an administrative figure that triggers additional appraisal requirements, not a loan amount limit.
What the Research Shows Works (and What Doesn’t)
What the HUD, CFPB, FHFA, and NAR data consistently supports
Separating affordability from qualification before talking to a lender.
The research finds this distinction is the most practically important one a buyer can make. Knowing the 30% HUD ceiling for housing costs gives buyers a floor for their own budget; knowing the 43% CFPB QM ceiling gives them a ceiling for what a lender may approve. The gap between those two figures is the buyer’s decision space — not the lender’s.
Using gross-to-take-home comparison before committing to a payment.
The 30% HUD standard is calculated on gross income — but the mortgage payment comes from take-home pay. Mapping 30% of gross income back against actual monthly cash flow shows whether the federally defined “affordable” payment leaves enough room for other expenses.
Including all housing costs in the 30% test, not just P&I.
Property taxes, homeowner’s insurance, PMI (if applicable), HOA fees, and utilities all belong in the housing-cost bucket. A mortgage P&I that consumes 30% of gross income alone is almost certainly above the HUD affordability standard once those items are added.
Treating existing monthly debt as the primary constraint on mortgage eligibility.
The DTI calculation is income minus existing debt, not income alone. A borrower with minimal debt and average income can qualify for a significantly larger mortgage than a borrower with the same income but substantial monthly obligations.
What the data says doesn’t work
Treating the 28/36 rule as a federal requirement.
The research explicitly identifies this as a misconception. The CFPB’s QM ceiling is 43% total DTI; the 28/36 approach is a conventional underwriting guideline. Different calculators produce different answers precisely because they use different benchmarks.
Using gross income as the actual payment capacity.
Tax withholding, retirement contributions, and other pre-tax deductions reduce take-home pay substantially below gross income. A buyer who maps 30% of gross against their actual checking account will usually find the number more restrictive than it first appears.
Treating qualification as confirmation of affordability.
The CFPB framework allows lenders to approve borrowers above HUD’s cost-burdened threshold. Qualifying for a larger loan isn’t the same as being able to comfortably carry one. About 50% of renters already spend more than 30% of income on housing — meaning many people live above the HUD standard, but the research associates that with reduced ability to save and greater financial stress.

Realistic Expectations for 2026 Home Buyers
The data paints a more difficult picture than many buyers expect. The NAR’s first-time buyer data alone is striking: 21% share, lowest since 1981, median age of 40. These aren’t demographic anomalies — they’re the output of sustained affordability pressure.
The 2026 conforming loan limit increase to $832,750 expands the conventional financing window, but the monthly payment at 6.65% on an $832,750 loan at 20% down comes to roughly $4,320 in P&I alone — well above the HUD 30% threshold for households earning below $173,000 in gross income annually. That illustrates why even buyers who qualify under DTI rules may find themselves above the federal affordability standard.
The research doesn’t offer an easy way around that math. What it does support is being precise about the calculation: how much gross income, how much existing debt, what down payment, what rate, and what are all housing costs beyond the P&I. The Mortgage Calculator is the fastest way to run that scenario honestly before making any decision.
Bottom Line: 5 Steps to Figure Out How Much House You Can Afford
1. Calculate 30% of your gross monthly income — but subtract property taxes, insurance, and utilities before treating the remainder as your mortgage budget:
The HUD 30% standard covers all housing costs, not just P&I. If taxes, insurance, and utilities total $800/month, that amount comes out of the 30% ceiling before anything goes toward the mortgage. This single step prevents most buyers from overestimating how much mortgage the HUD standard actually supports.
2. List every monthly debt obligation — student loans, car payments, credit card minimums — and subtract the total from 43% of gross monthly income to find your CFPB DTI ceiling for the mortgage:
That remaining figure is what a lender may approve. Compare it to the HUD-affordable figure from Step 1. The gap between the two is the decision you actually have to make — qualify for more, or stay within federal affordability standards.
3. Run both scenarios through the Mortgage Calculator at current rates (approximately 6.5%–6.7% as of mid-2026):
Enter the HUD-affordable P&I figure and see what purchase price it supports at your down payment. Then enter the CFPB DTI-limited figure and see the higher purchase price. That comparison makes the abstract percentages concrete before any lender conversation.
4. Check the 2026 loan limits for your target area and loan type before assuming a program applies:
The FHFA conforming baseline is $832,750 for 2026 — up from 2025. The FHA floor is $541,287 for most areas. Homes priced above the conforming limit require jumbo financing with different underwriting standards. Knowing which ceiling applies to your target price range determines which programs you’re comparing.
5. Compare the qualifying figure against your actual take-home pay — not gross income:
The DTI and affordability benchmarks use gross income. Your mortgage payment comes from what’s actually in your account. Map the qualifying monthly payment against your real monthly net pay before deciding it’s comfortable. If the payment consumes more than 40–45% of take-home pay, that gap between gross and net income is carrying significant risk the percentage frameworks don’t capture.
“When I went through the HUD affordability data and the CFPB’s Qualified Mortgage rules, the most important finding was the gap between two numbers most homebuyers have never compared side by side. HUD considers a household cost-burdened above 30% of gross income for housing. The CFPB’s QM rule lets lenders qualify borrowers up to 43% total DTI. That 13 percentage-point gap is where most buyers make their biggest financial mistake — qualifying for more than federal housing policy considers affordable, without realising those are different questions.”
— Kevin Brown, Lead Researcher at SaveXpert.com
Frequently Asked Questions
Ans: The HUD affordability framework sets 30% of gross household income as the ceiling for total housing costs — covering mortgage principal and interest, property taxes, homeowner’s insurance, and utilities. That 30% doesn’t represent the mortgage payment alone; it represents all housing expenses combined. Households spending above 30% are classified as cost-burdened; above 50% as severely cost-burdened. The research also notes that roughly 50% of renters already exceed the 30% threshold.
Ans: HUD’s affordability framework recommends keeping total housing costs at or below 30% of gross pre-tax household income. This is a federal housing-policy standard — different from the mortgage qualification rules lenders apply. The distinction is important: a lender using the CFPB’s 43% total DTI ceiling can legally approve a housing payment above the HUD 30% affordability standard. These are separate frameworks with different purposes.
Ans: According to NAR’s 2025 buyer data, the median down payment for first-time buyers is 10%, while the median for all buyers is 19%. FHA financing can require as little as 3.5% down. The 20% figure is not a universal qualification requirement — it relates to avoiding private mortgage insurance (PMI) on most conventional loans. PMI adds to the monthly housing cost and should be included in the HUD 30% housing-cost calculation. The 2026 FHFA conforming loan baseline is $832,750; FHA floors start at $541,287.
Ans: The CFPB’s original Qualified Mortgage rule uses a 43% total DTI ceiling — meaning total monthly debt obligations (housing costs plus all other debts) should not exceed 43% of gross monthly income. This differs from the HUD 30% housing-cost standard: a borrower with minimal non-housing debt can qualify for a housing payment that exceeds the HUD affordability threshold while staying within the 43% QM ceiling. The research notes that some borrowers with stronger credit and larger down payments can exceed 43% DTI with certain lenders, though CFPB analysis associates higher DTI with greater default probability.
Ans: Yes — student loan payments count as monthly debt obligations in the DTI calculation. Every dollar of monthly student loan payment reduces the maximum housing cost a lender can approve while staying within the 43% QM ceiling. The research doesn’t provide a specific formula for how lenders treat different student loan repayment plans, but the principle is consistent: total monthly debt (including student loans, car payments, credit card minimums, and the proposed mortgage) must stay within the DTI ceiling for a Qualified Mortgage. Higher existing debt means less room for the mortgage payment.
Ans: The HUD 30% standard applies to total housing costs (mortgage + taxes + insurance + utilities) as a share of gross income, and is used in federal housing policy to classify households as cost-burdened. The 28/36 rule is a conventional mortgage underwriting guideline — not a federal requirement — that suggests housing costs stay below 28% of gross income and total debt below 36%. The CFPB’s Qualified Mortgage framework uses a separate 43% total DTI ceiling. These three benchmarks produce different answers for the same household, which is why different affordability calculators give different results. The research identifies the 28/36 approach as conventional guidance rather than a federal standard.