
ⓘ Educational Disclosure:
This article is for educational and informational purposes only. It does not constitute financial, legal, tax, lending, or investment advice. SaveXpert and its authors are not licensed financial advisors, CPAs, attorneys, or tax advisors. All data comes from publicly available government and institutional sources. Always consult a qualified professional before making investment decisions.
What is the mortgage rate forecast for late 2026? The institutional consensus puts the average 30-year fixed mortgage rate at roughly 6.7%–6.8% for Q4 2026. Fannie Mae’s August 2026 forecast projects 6.8%. The Mortgage Bankers Association projects approximately 6.7% for the same period. Freddie Mac’s September 3, 2026 reading already stands at 6.71% — inside the forecast range. None of the mainstream institutional forecasts expect rates below 6% before 2028. The Federal Reserve H.15 data shows the 10-year Treasury yield at 4.77% on September 3, which helps explain why mortgage rates remain elevated even while the Fed holds its policy rate at 3.50%–3.75%.
Key Takeaways
- Problem: Homebuyers are waiting for mortgage rates to fall significantly before purchasing — but the available institutional forecast data suggests that wait could extend well past 2026.
- Solution: Fannie Mae projects 6.8% for Q4 2026 (revised up from 6.4% in a single month). The MBA projects 6.7%. The Freddie Mac September 3 reading is already 6.71% — inside that forecast range. None of the mainstream institutional forecasts expect rates below 6% before 2028.
- Result: The research supports comparing actual current loan terms across lenders rather than timing the market. Rate differences across lenders run 0.05%–0.15%, and on a $400,000 loan, a 0.3% rate difference adds roughly $32,000 in total interest over 30 years.
- Source: Freddie Mac PMMS, Fannie Mae Housing Forecast, Federal Reserve H.15
- Time To Read: 8 Minutes
Table of Contents
1. The Mortgage Rate Forecast for Late 2026 Points to 6.7%–6.8%
2. The Federal Reserve Affects Mortgage Rates — But Doesn’t Set Them
3. Current Mortgage Rates Are Already Above Last Year’s Level
4. Fixed vs. Adjustable Mortgages: What the Data Does and Doesn’t Show
5. Why Small Rate Differences Matter More Than They Look
6. Lock Now or Wait? What the Data Actually Shows
7. What the Research Shows Works (and What Doesn’t)
8. Realistic Expectations for Late 2026
As of September 3, 2026, the average 30-year fixed mortgage rate sits at 6.71% — the highest since July 2025. The institutional forecasters have already told us where they think it’s going: Fannie Mae projects 6.8% in Q4 2026. The Mortgage Bankers Association projects 6.7%. Neither expects rates below 6% before 2028. The question isn’t whether those forecasts are certain — they’re not. The question is what the available data actually supports when planning a late 2026 mortgage decision.
The Mortgage Rate Forecast for Late 2026 Points to 6.7%–6.8%
The most useful finding in the data isn’t a single number — it’s the convergence of the major institutional forecasts around the same range.
| Forecaster | Q4 2026 Forecast | 2027 Annual Forecast | Notable |
|---|---|---|---|
| Fannie Mae (August 2026) | 6.8% | 6.7% | Revised UP from 6.4% in one month |
| Mortgage Bankers Association | ~6.7% | 6.7% | Revised UP from 6.5% for 2027 |
| Freddie Mac PMMS (Sep 3, 2026) | 6.71% (current reading) | — | Already inside the forecast range |
Source: Fannie Mae Housing Forecast August 2026 · MBA Mortgage Finance Forecast · Freddie Mac PMMS September 3, 2026
Several things in this table deserve attention beyond the headline numbers.
First, both Fannie Mae and the MBA revised their forecasts upward in recent months. Fannie Mae’s Q4 move from 6.4% to 6.8% happened within a single month. The MBA raised its 2027 forecast from 6.5% to 6.7%. These revisions don’t point toward imminent relief for borrowers who’ve been waiting for rates to drop.
Second, the current Freddie Mac rate of 6.71% already sits inside the Q4 forecast range. That means today’s rates aren’t materially above what the forecasters expect for the rest of the year — which removes one of the common justifications for waiting.
Third, and most clearly: none of the mainstream institutional forecasts expect 30-year rates below 6% before 2028. That doesn’t make such a decline impossible. It shows where the institutional consensus currently sits.
💡 Research note: Fannie Mae’s annual 2026 average forecast is 6.5%, below the Q4 forecast of 6.8%. That reflects rates being somewhat lower earlier in 2026 — not an expectation of Q4 relief. The 2027 annual forecast of 6.7% suggests the elevated environment persists into next year.
The Federal Reserve Affects Mortgage Rates — But Doesn’t Set Them
This is one of the most commonly misunderstood relationships in mortgage planning — and one of the clearest findings in the research.
The Federal Reserve controls the federal funds rate: the overnight lending rate between banks. At the July 29, 2026 FOMC meeting, the committee voted 9–3 to keep the federal funds target range at 3.50%–3.75%. The effective federal funds rate stood at 3.63% on September 3.
At the same time, Federal Reserve H.15 data showed the 10-year Treasury yield at 4.77% — and the 30-year mortgage rate at 6.71%. The gap between the Fed’s policy rate (3.63%) and the 30-year mortgage rate (6.71%) is more than 3 percentage points.
| Rate / Yield | September 3, 2026 | Set By |
|---|---|---|
| Federal funds target range | 3.50%–3.75% | Federal Reserve FOMC |
| Effective federal funds rate | 3.63% | Open market operations |
| 10-year Treasury yield | 4.77% | Bond market |
| 30-year fixed mortgage rate (Freddie Mac) | 6.71% | Mortgage market/lenders |
| Spread: 10-year Treasury to mortgage rate | ~1.94 pp | Reflects MBS risk premium |
Source: Federal Reserve H.15 (Sep 3, 2026) · FOMC July 29, 2026 statement · Freddie Mac PMMS
Mortgage pricing responds to factors including 10-year Treasury yields, mortgage-backed securities (MBS) demand, lender competition, inflation expectations, and housing demand. The Fed’s policy rate influences those factors indirectly — but not mechanically. The research found that in 2026, the Fed held its policy rate steady at 3.50%–3.75% while 30-year mortgage rates still fluctuated between roughly 6.50% and 6.80%.
The research brief also notes that the next scheduled FOMC meeting is September 15–16, 2026, with the rate decision expected September 16 at 2:00 PM Eastern Time. That decision could influence broader borrowing conditions — but the available research doesn’t establish that it will produce a specific mortgage rate change in any direction.
⚠️ A Fed cut doesn’t automatically lower mortgage rates: The data shows a 3+ percentage-point gap between the Fed’s policy rate and the mortgage rate. Even after a hypothetical 0.25% Fed cut, the 10-year Treasury yield and MBS market conditions would still determine whether and by how much mortgage rates respond. The research doesn’t support assuming a 1-for-1 pass-through from Fed moves to mortgage rates.

Current Mortgage Rates Are Already Above Last Year’s Level
The September 3, 2026 Freddie Mac data doesn’t just tell us where rates are now — it tells us where they’ve been going.
| Loan Type | September 3, 2026 | September 2025 | Change (YoY) |
|---|---|---|---|
| 30-year fixed (Freddie Mac) | 6.71% | 6.50% | +0.21 pp |
| 15-year fixed (Freddie Mac) | 6.04% | 5.60% | +0.44 pp |
| 30-year fixed (Bankrate, Sep 2) | 6.76% | — | — |
| 30-year conforming (MBA, Aug 26) | 6.78% | — | — |
| 30-year jumbo (MBA, Aug 26) | 6.73% | — | — |
| 15-year fixed (Bankrate, Sep 2) | 6.08% | — | — |
Source: Freddie Mac PMMS September 3, 2026 · Bankrate September 2 · MBA August 26 weekly survey
Two findings here matter for anyone who has been waiting for rates to fall. The 30-year fixed rate is higher than it was a year ago — not lower. The 15-year fixed is also up significantly, by 0.44 percentage points year-over-year.
The research brief specifically calls out the “waiting to save money” assumption as a misconception the data doesn’t support. The comparison is direct: borrowers who waited from September 2025 to September 2026 found rates higher, not lower.
The rate figures also vary across sources — Freddie Mac, Bankrate, and MBA show slightly different readings for the same period. The research explains why: each source uses its own methodology and market sample. Freddie Mac’s PMMS has used Loan Product Advisor application data since November 2022, not lender surveys. These methodological differences produce readings that can vary by 0.05%–0.15%.
Fixed vs. Adjustable Mortgages: What the Data Does and Doesn’t Show
The research brief focuses primarily on 30-year fixed mortgage rates — the product with the most complete institutional forecast coverage and the clearest benchmark function for planning purposes.
The distinction between loan types matters for rate decisions, but the data has a clear limitation here.
A fixed-rate mortgage keeps its stated interest rate constant under the loan terms. The payment and interest cost are fully predictable across the life of the loan.
An adjustable-rate mortgage (ARM) carries an initial fixed period, after which the rate adjusts based on a reference index and caps defined in the loan terms. ARMs can offer a lower initial rate — but the future payment is not guaranteed.
The research packet doesn’t provide a detailed ARM forecast or specific ARM adjustment rules for late 2026. Because of that data gap, the available research can’t support a precise fixed vs. ARM comparison for this period. What the data does support is the importance of comparing actual loan terms — including the adjustment terms and caps on any ARM product — rather than comparing headline rates alone.
Estimate your monthly payment and total interest in seconds.
Federal mortgage disclosure rules every borrower should know
The CFPB enforces several consumer protections that apply to every mortgage transaction regardless of rate environment:
The Truth in Lending Act (TILA) requires lenders to disclose mortgage terms, APR, and total costs before closing. The TILA-RESPA Integrated Disclosure (TRID) rules require standardised Loan Estimate and Closing Disclosure forms for most mortgage transactions. These disclosures let borrowers compare actual offers on the same standardised basis — the most reliable way to compare across lenders in any rate environment.
Why Small Rate Differences Matter More Than They Look
A 0.1% or 0.2% difference in mortgage rate can seem trivial. The 30-year math turns it into something much more significant.
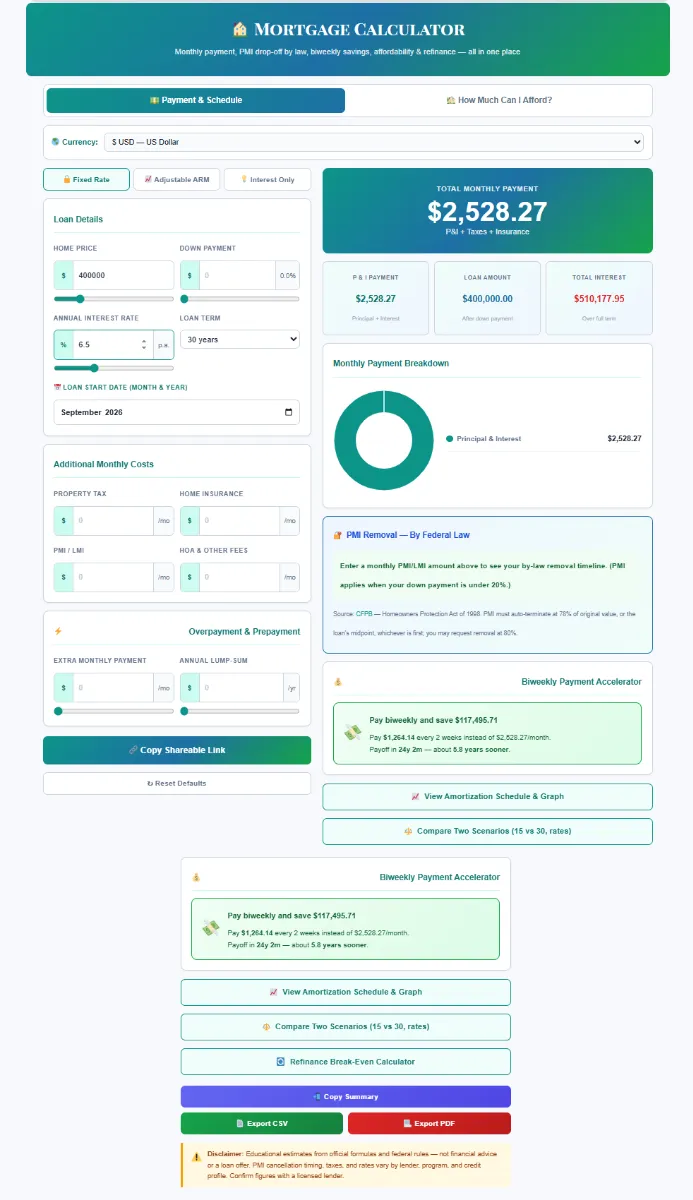
I ran three scenarios through the Mortgage Calculator using the forecast range: 6.5%, 6.8%, and 7.0% on a $400,000 loan.
| Rate | Monthly P&I ($400K, 30-year) | Total Interest (30-year) | vs. 6.5% Scenario |
|---|---|---|---|
| 6.5% | ~$2,528 | ~$509,942 | — |
| 6.8% (Fannie Mae Q4 forecast) | ~$2,610 | ~$539,632 | +$82/mo · +$29,690 total |
| 7.0% | ~$2,661 | ~$558,069 | +$133/mo · +$48,127 total |
Illustrative calculation — actual payments depend on loan amount, term, lender fees, and individual borrower factors. P&I only; excludes taxes, insurance, PMI. Source: SaveXpert Mortgage Calculator
The 0.3 percentage-point difference between 6.5% and 6.8% produces roughly $82 more per month and nearly $30,000 in additional total interest over 30 years. That’s the dollar context for what the institutional forecasters mean when they talk about the difference between 6.5% and 6.8%.
The same math applies to the 0.05%–0.15% rate differences the research found across lenders for the same market conditions. On a $400,000 loan, a 0.15% rate difference represents about $41/month and more than $14,000 over 30 years — from shopping among lenders at identical market conditions.
🏠 Run Your Own Scenarios: SaveXpert Mortgage Calculator
I ran the three forecast-range scenarios (6.5%, 6.8%, 7.0%) on a $400,000 loan through the Mortgage Calculator. The monthly payment difference between the best and worst case in that range is $133 — and the 30-year total interest difference is more than $48,000. Put your own loan amount in and compare the three rates. It turns an abstract forecast into a concrete decision about whether waiting a few months for a rate that may not materialise is actually worth more than the monthly cost of a current rate.
Educational note: This calculator models payment scenarios for informational purposes only and does not provide personalized mortgage or financial advice. Source: Freddie Mac PMMS · Fannie Mae Forecast
Lock Now or Wait? What the Data Actually Shows
The research doesn’t give a universal answer — and anything that claims to is overstating what the data supports. But it does give several findings that bear directly on the decision.
The current rate already sits in the forecast range.
Freddie Mac’s September 3 reading of 6.71% is essentially where Fannie Mae and the MBA expect Q4 2026 to land. Waiting for rates to drop significantly from current levels means waiting for an outcome that isn’t in the institutional forecast.
Forecasts have been revised upward, not downward.
Fannie Mae moved its Q4 forecast from 6.4% to 6.8% in a single month. The MBA moved its 2027 forecast from 6.5% to 6.7%. The direction of revision matters: the institutional consensus has been moving toward higher, not lower, expectations.
The market didn’t fall in the past 12 months.
The 30-year rate was 6.50% in September 2025 and 6.71% in September 2026. Borrowers who waited that year found rates higher — the research flags this as the clearest data point against the “wait for a lower rate” assumption.
Lender comparison matters as much as market timing.
The research found rate differences of 0.05%–0.15% across lenders for identical market conditions. A borrower who accepts the first offer rather than comparing three lenders may be paying a rate premium that market timing was never going to close anyway.
💡 Research note: The research doesn’t support promising that waiting will produce a lower rate. It supports comparing the cost of waiting — months without a home, continued rent payments, ongoing uncertainty — against the actual terms available today from at least three lenders.

What the Research Shows Works (and What Doesn’t)
What the data consistently supports
Using Freddie Mac’s PMMS as the primary weekly benchmark.
The PMMS has used Loan Product Advisor application data since November 2022 — actual loan applications, not lender surveys. It covers conventional, conforming, fully amortising purchase loans with 20% down and excellent credit. That makes it the most methodologically robust weekly reference for the 30-year fixed rate.
Cross-referencing multiple institutional forecasts rather than relying on one.
Fannie Mae, MBA, and Freddie Mac’s current readings all cluster around 6.7%–6.8% for Q4 2026. That convergence gives more confidence in the range than any single forecast would.
Shopping across at least three lenders before accepting any offer.
Rate differences of 0.05%–0.15% across sources add up significantly over a 30-year term. The Loan Estimate form (required under TRID) makes it possible to compare total costs across lenders on a standardised basis.
Running the Mortgage Calculator at multiple rate scenarios before deciding.
The difference between 6.5% and 7.0% on a $400,000 loan is $133/month and more than $48,000 in total interest. Knowing those numbers makes the lock-or-wait decision concrete rather than speculative.
What the data says doesn’t work
Waiting for a sub-6% rate in 2026.
None of the mainstream institutional forecasts expect that outcome before 2028. Building a home-buying plan around that expectation means betting against the institutional consensus.
Assuming a Fed rate cut automatically lowers mortgage rates.
The September 15–16 FOMC meeting may produce a rate decision — but the research shows that mortgage rates respond to 10-year Treasury yields, MBS demand, and other bond-market factors that don’t move lockstep with the federal funds rate. A 0.25% Fed cut doesn’t guarantee a 0.25% mortgage rate drop.
Treating one rate survey as definitive.
Freddie Mac, Bankrate, and MBA showed readings of 6.71%, 6.76%, and 6.78% for essentially the same period. Each uses a different methodology and sample. The range of results across sources gives a better picture than any single reading.
Realistic Expectations for Late 2026
Based on the available research, the most defensible expectation for late 2026 mortgage rates is a continued elevated environment around the upper-6% range — likely 6.7%–6.8% — with meaningful uncertainty in either direction.
The Fannie Mae forecast revision from 6.4% to 6.8% in a single month illustrates how quickly the picture can change. That specific example cuts in both directions — rates could move down just as quickly if bond-market conditions shift. But as of September 2026, every major revision has been upward.
The most useful preparation isn’t finding the exact future rate — it’s knowing today’s rate, understanding the forecast range, and having run the Mortgage Calculator across the realistic scenarios (6.5%–7.0%) so that any offer from a lender can be immediately evaluated against what the institutional data says is plausible.
Bottom Line: 5 Steps for Late 2026 Mortgage Decisions
1. Use the Freddie Mac PMMS as your weekly rate benchmark — it’s the most methodologically robust public source:
The PMMS uses actual Loan Product Advisor application data since November 2022, not lender surveys. It covers conventional conforming purchase loans with 20% down and excellent credit. Check it weekly at freddiemac.com/pmms and cross-reference it against the Federal Reserve H.15 10-year Treasury yield to understand where the spread is running.
2. Anchor your planning to the institutional forecast range of 6.7%–6.8% for Q4 2026 — not to a hoped-for lower rate:
Fannie Mae projects 6.8%. MBA projects 6.7%. Both revised upward recently. The current Freddie Mac reading of 6.71% is already inside that range. None of the mainstream forecasts expect below 6% before 2028. Building a mortgage plan that requires significantly lower rates means betting against the institutional consensus.
3. Run the Mortgage Calculator at 6.5%, 6.8%, and 7.0% on your actual loan amount before any lender conversation:
On a $400,000 loan, the payment difference between 6.5% and 7.0% is $133/month and more than $48,000 in total interest over 30 years. Knowing those numbers turns an abstract rate discussion into a concrete affordability question — and tells you how much a 0.1% rate difference from lender comparison actually saves.
4. Compare at least 3 lenders using the standardised Loan Estimate form before choosing:
The research found rate differences of 0.05%–0.15% across lenders in identical market conditions. The TRID-required Loan Estimate gives every lender’s total cost in a comparable format. On a $400,000 loan, a 0.15% rate difference is roughly $41/month and $14,600 over 30 years — available from shopping, not from waiting for the market to move.
5. Watch the September 16 FOMC decision — but don’t assume it directly determines your mortgage rate:
The FOMC meets September 15–16 with a decision at 2:00 PM ET on September 16. Any change to the federal funds rate influences bond-market conditions that eventually affect mortgage rates — but not mechanically or immediately. The 10-year Treasury yield (4.77% on September 3) and MBS demand drive the mortgage rate spread more directly than the policy rate itself.
“When I went through the Federal Reserve H.15 data and the Fannie Mae and MBA forecasts side by side, the number that stood out wasn’t the forecast itself — it was the speed of the revision. Fannie Mae moved its Q4 2026 forecast from 6.4% to 6.8% inside one month. That’s a 0.4 percentage-point swing in 30 days. The research strongly suggests that anyone waiting for a specific rate to materialise before making a mortgage decision is placing a timing bet that even the institutional forecasters can’t reliably make.”
— Kevin Brown, Lead Researcher at SaveXpert.com
Frequently Asked Questions
Ans: The institutional consensus clusters around 6.7%–6.8% for Q4 2026. Fannie Mae’s August 2026 forecast projects 6.8% for Q4 and a 6.5% annual 2026 average. The Mortgage Bankers Association projects approximately 6.7% for both Q4 2026 and throughout 2027. Freddie Mac’s September 3 reading is 6.71% — already inside the forecast range. None of the mainstream institutional forecasts expects the 30-year rate to fall below 6% before 2028.
Ans: The Federal Reserve controls the federal funds rate — which stood at 3.50%–3.75% after the July 29, 2026 FOMC meeting. Mortgage rates respond to different factors: primarily the 10-year Treasury yield (4.77% on September 3), mortgage-backed securities demand, inflation expectations, and lender competition. The Federal Reserve H.15 data shows a gap of more than 3 percentage points between the policy rate and the 30-year mortgage rate — demonstrating that a Fed cut doesn’t automatically produce an equal mortgage-rate reduction.
Ans: Freddie Mac’s PMMS reported a 6.71% average 30-year fixed mortgage rate on September 3, 2026 — the highest since July 2025 and up from 6.50% in September 2025. The 15-year fixed rate stands at 6.04%, up from 5.60% a year earlier. Bankrate’s September 2 reading was 6.76% for the 30-year. The MBA reported 6.78% for 30-year conforming loans on August 26. Rate differences across sources reflect different methodologies and market samples rather than inconsistent data.
Ans: The research doesn’t give a universal answer. What it does show is that the current 6.71% Freddie Mac rate already sits inside the institutional forecast range for Q4 2026 (6.7%–6.8%), that both Fannie Mae and the MBA have revised their forecasts upward recently, and that the 30-year rate rose from 6.50% to 6.71% over the past year — meaning borrowers who waited in 2025 found higher rates in 2026. The research supports comparing actual current lender offers against these benchmarks rather than waiting for a rate decline the institutional forecasts don’t project.
Ans: A fixed-rate mortgage keeps its stated interest rate constant for the life of the loan — the monthly P&I payment never changes. An adjustable-rate mortgage (ARM) carries an initial fixed period, after which the rate adjusts periodically based on a reference index and the caps defined in the loan terms. ARMs can offer lower initial rates but introduce payment uncertainty after the fixed period ends. The research brief focuses on 30-year fixed rates because they provide the clearest institutional forecast benchmark. For ARMs, the CFPB’s Loan Estimate disclosure shows the maximum rate and payment the loan could ever reach — the number to compare against a fixed-rate alternative.
Ans: The Federal Reserve’s H.15 data illustrates this directly. In 2026, the Fed held its policy rate at 3.50%–3.75% while the 30-year mortgage rate fluctuated between roughly 6.50% and 6.80%. The spread between the federal funds rate and mortgage rates reflects factors the Fed doesn’t directly control: the 10-year Treasury yield (4.77% on September 3), the premium investors require for holding mortgage-backed securities (which carry prepayment and default risk), inflation expectations, and lender competition. When any of those factors push yields higher, mortgage rates rise even if the Fed hasn’t moved — which is precisely what the 2026 data shows.