

ⓘ Educational Disclosure:
This article is for educational and informational purposes only. It does not constitute financial, legal, tax, lending, or investment advice. SaveXpert and its authors are not licensed financial advisors, CPAs, attorneys, or tax advisors. All data comes from publicly available government and institutional sources. Always consult a qualified professional before making investment decisions.
Is fall 2026 a good time to buy a house? Based on the most recent available data, the answer depends on local inventory and household finances — not on a national seasonal pattern. The NAR’s July 2026 report shows a $434,100 median existing-home price, 4.6 months of supply, and 37 consecutive months of year-over-year price gains. National prices have not shown an automatic fall decline. As of September 2026, NAR data covers only through July — meaning September, October, and November conditions aren’t yet established by national figures. The research supports benchmarking against July data, calculating household-level mortgage costs, and verifying local inventory rather than relying on seasonal assumptions.
Key Takeaways
- Problem: Many buyers assume fall brings lower home prices and better conditions nationally — but the available NAR data through July 2026 doesn’t establish that pattern, and September–November figures haven’t been published yet.
- Solution: The NAR’s July 2026 report shows a $434,100 median existing-home price (+2.0% YoY), 4.6 months of inventory, and 37 consecutive months of year-over-year price gains — none of which support a universal “fall is better” conclusion.
- Result: Fall 2026 buyers should benchmark against the July data — the most current available — calculate household-level mortgage costs, verify local inventory, and treat federal affordability rules as the floor, not the ceiling.
- Source: NAR Existing-Home Sales Report (August 11, 2026), Regulation Z / 15 U.S.C. §1639c
- Time To Read: 7 Minutes
Table of Contents
1. Fall 2026 Housing Data Has One Important Limitation
2. What the NAR July 2026 Report Actually Shows
3. Mortgage Rates Matter More Than the Calendar Alone
4. What About Buying in October or November?
5. What Mortgage Costs Can Look Like at the Reported Rate
6. Mortgage Interest Deductions Don’t Automatically Make a House Affordable
7. What Happens After an Offer Is Accepted?
8. Buyer’s Market vs. Seller’s Market: What This Research Can Establish
9. What the Data Shows Works (and What Doesn’t)
10. Realistic Expectations for a Fall 2026 Home Buyer
The most surprising finding in the NAR’s latest housing data wasn’t a price decline. It was a contradiction. The July 2026 existing-home sales report showed sales falling 1.7% from June — while the median price rose 2.0% from a year earlier to reach $434,100. Two signals pointing in different directions at the same time. That contradiction is the most honest answer the data gives on whether fall 2026 is a good time to buy a house.
Fall 2026 Housing Data Has One Important Limitation
As of September 8, 2026, the newest NAR existing-home sales release covers July. That report was published August 11. This isn’t a minor detail — it’s the central limitation on everything that follows.
July figures can’t prove what September, October, or November will look like. The question “Is fall a good time to buy a house in 2026?” can’t be answered with July data. What July data can do is tell us what the market looked like immediately before fall — and whether there are any signals that would support or undercut a seasonal-optimism argument.
⚠️ The research can’t answer fall conditions yet: The available national evidence doesn’t support a definitive yes or no on fall 2026 housing market conditions. Local markets can differ significantly from national figures. The July data specifically doesn’t establish favorable or unfavorable fall conditions for every market or household. This article presents what the data does show — and is equally specific about what it doesn’t.

What the NAR July 2026 Report Actually Shows
I went through the NAR’s July 2026 existing-home sales release specifically looking for evidence that fall buyers might see lower prices due to real estate seasonality. The data doesn’t establish that conclusion.
| NAR July 2026 Metric | Figure | Change |
|---|---|---|
| Existing-home sales (SAAR) | 4.06 million | –1.7% from June · +0.7% from July 2025 |
| Median existing-home price | $434,100 | +2.0% year over year |
| Prior-year median (July 2025) | $425,700 | — |
| Consecutive months of YoY price gains | 37 months | Through July 2026 |
| Unsold existing homes (inventory) | 1.54 million units | –1.9% from June · –0.6% from July 2025 |
| Months of supply | 4.6 months | At the July sales pace |
What the contradiction tells us
The July numbers point in two different directions simultaneously. Sales fell 1.7% from June — the kind of number that might suggest softening demand. But the median price still rose 2.0% year over year. Weaker monthly sales activity didn’t translate into lower national prices.
The 37-consecutive-months figure is the single most important data point for buyers who expect fall to bring price relief. Thirty-seven straight months of year-over-year price gains means the market hasn’t delivered an annual price decline in more than three years. Expecting seasonal softening to reverse that trend requires evidence the current data doesn’t provide.
What the inventory number does and doesn’t tell us
The 4.6 months of supply is often described in real estate coverage using buyer’s-market and seller’s-market language. But the July data itself shows why that framing can mislead. Inventory stood at 4.6 months in July — and prices still increased 2.0% year over year. The 4.6-month figure did not produce price declines in the period it covers.
The research doesn’t support using one inventory number as a market verdict.
Mortgage Rates Matter More Than the Calendar Alone
The research brief reports a 6.71% average 30-year fixed mortgage rate for the week ending September 3, 2026. This figure comes from Freddie Mac data as quoted by Reuters — and the research brief specifically flags it because Reuters is an intermediary source rather than a primary government publication. Treat 6.71% as a reference point for modeling, not as a verified official statistic.
What the research does establish through official sources is the direction of travel. The NAR’s August 11 release described the market as stable despite a rising-rate environment in the months preceding the July report. Rates had been moving upward in the period the July data covers.
The Federal Reserve distinction that matters
A common misconception is that the Federal Reserve directly sets mortgage rates. It doesn’t. The Fed sets a short-term policy-rate target. A lower or higher Federal Reserve target doesn’t translate mechanically into the mortgage rate a buyer receives on an individual home loan.
The research brief specifically warns against treating the federal funds rate and mortgage APRs as the same thing. A fall 2026 Fed decision — if one occurs — doesn’t automatically produce a corresponding shift in the 30-year fixed rate a buyer will see at closing.
💡 Research note: The research brief doesn’t provide a verified numerical mortgage-rate series for earlier 2026 — so a precise start-of-year versus fall comparison isn’t available from the supplied sources. The 6.71% figure represents the most recent data point in the research, but it should be verified against Freddie Mac’s primary release before using it in any financial decision.
Estimate your monthly payment and total interest in seconds.
What About Buying in October or November?
This is the question the research is most direct about: the available data doesn’t establish a universal October or November advantage.
It doesn’t show that national prices automatically fall during those months. It doesn’t provide fall-specific inventory or transaction data to prove buyers will face better conditions in late 2026. That’s not a judgment about individual markets — it’s a statement about what the national data available as of September 8 can and cannot support.
That doesn’t mean individual buyers won’t find opportunities in fall. Local markets vary substantially from national figures. A specific metropolitan area may have higher or lower inventory, more or fewer price reductions, and more or less seller flexibility than the NAR national average suggests. The research brief specifically notes that July national data doesn’t establish favorable fall conditions for every local market or household.
The practical implication is that October and November buyers should check their specific market’s inventory and days-on-market data from local MLS sources — not assume the national 4.6 months of supply applies directly to their ZIP code.

See which path builds more wealth over your stay.
What Mortgage Costs Can Look Like at the Reported Rate
This is where the national data becomes useful at a household level — not for predicting the market, but for modeling what the reported price and rate mean in actual dollars.
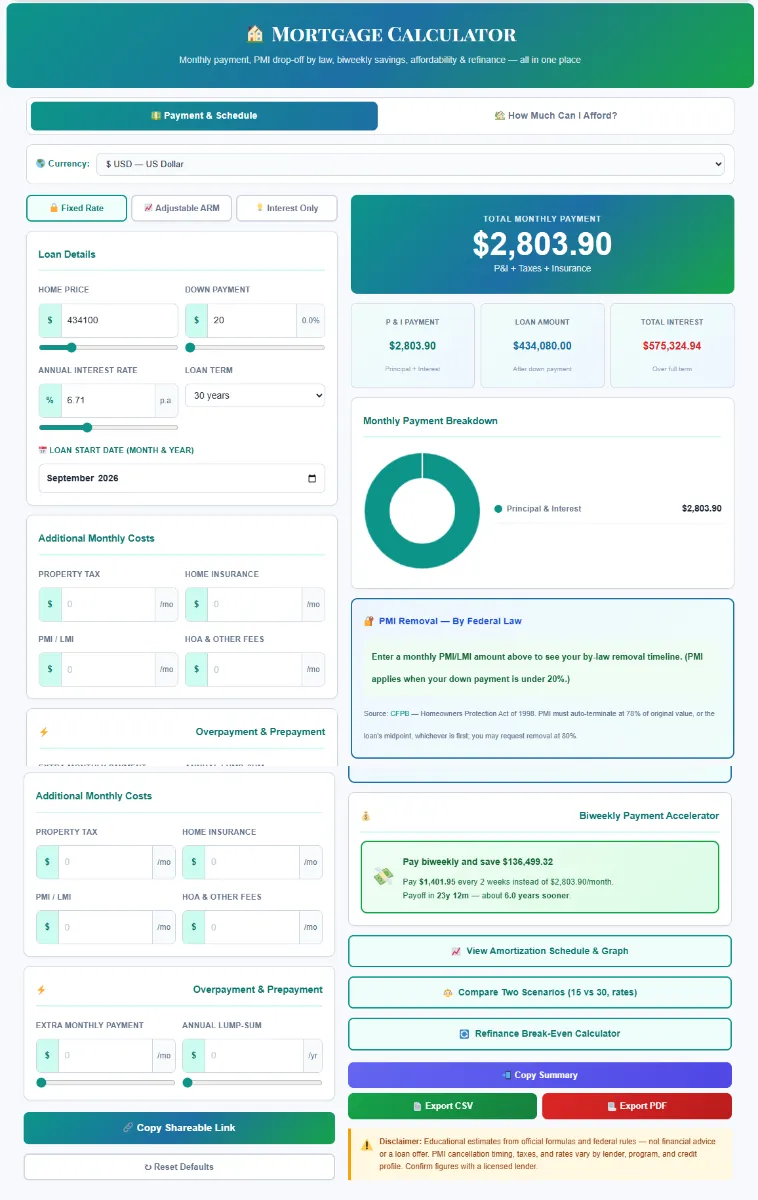
I ran the July median price of $434,100 through the Mortgage Calculator using a 20% down payment and the 6.71% 30-year rate reported for September 3. The resulting principal-and-interest payment comes to approximately $2,243 per month.
| Mortgage Scenario (July 2026 median, 6.71% rate) | Figure |
|---|---|
| Purchase price | $434,100 |
| Down payment (20%) | $86,820 |
| Loan amount | $347,280 |
| Rate (30-year fixed, week ending Sep 3) | 6.71% |
| Monthly principal & interest payment | ~$2,243 |
| Total P&I over 30 years | ~$807,480 |
Note: This is a mathematical illustration only. It excludes property taxes, homeowner’s insurance, PMI, HOA fees, and closing costs. Rate from Freddie Mac via Reuters — not a verified primary government source. Source: NAR, July 2026
That $2,243/month covers only principal and interest. A realistic monthly housing cost for a $434,100 home in 2026 also includes property taxes, homeowner’s insurance, and potentially HOA fees — none of which are captured in the P&I figure alone. Two households looking at the same national median could face substantially different total monthly costs depending on their down payment, local tax rates, and lender-specific rate offers.
The federal affordability requirement adds another layer. Under Regulation Z (15 U.S.C. §1639c), lenders must make a reasonable and good-faith determination that a borrower can reasonably repay a covered mortgage loan. That’s an Ability-to-Repay standard — not a comfort check. The research supports looking beyond the headline home price to total monthly housing cost and its relationship to household income.
🏠 Model Your Own Numbers: SaveXpert Mortgage Calculator
I put the July 2026 national median ($434,100, 20% down, 6.71%) through the Mortgage Calculator to get the $2,803.90/month P&I figure. But the national median isn’t your price — your local market, down payment, credit score, and rate offer are. Put your own numbers in. The calculation shows how changing the down payment by $20,000 or the rate by 0.5% shifts the monthly figure more than most buyers expect before they run the math.
Educational note: These calculators model scenarios for informational purposes only and do not provide personalized financial or real estate advice. Rate source: Freddie Mac via Reuters (not a verified primary government source — verify before use). Source: NAR July 2026 Report
Mortgage Interest Deductions Don’t Automatically Make a House Affordable
Tax benefits often appear in home-buying conversations as a cost offset. The research brief gives a specific finding on this: the IRS published a homeowner tax-benefit reminder on May 21, 2026. That notice served as an educational reminder — it didn’t announce a statutory change.
What the IRS source says: eligible homeowners may deduct home mortgage interest within applicable limits. The research brief specifically flags that a $750,000 threshold appeared in the supplied research but was not confirmed on the IRS page itself. The brief recommends not citing that specific figure without independent verification from primary IRS guidance on mortgage interest deductibility.
The practical point is this: deductibility depends on applicable limits and each taxpayer’s specific circumstances. A mortgage doesn’t automatically create a federal tax benefit for every homeowner.
And critically — NAR data measures sales, prices, and inventory. IRS rules address potentially deductible mortgage interest. One doesn’t establish the other. The research brief treats them as separate questions that shouldn’t be conflated in any affordability calculation.
💡 Research note: Consult a qualified tax professional before factoring any mortgage interest deduction into a home-affordability calculation. The deductibility of mortgage interest depends on factors specific to each taxpayer — including whether they itemize deductions, the loan amount, and the year the loan was originated.
What Happens After an Offer Is Accepted?
The research brief looked specifically at the closing process for covered residential mortgages. One federal requirement applies clearly: under Regulation Z, for most covered closed-end residential mortgages, creditors must ensure the consumer receives the Closing Disclosure no later than three business days before consummation.
That’s a concrete federal rule. It answers part of the common “how long does it take to close on a house” question — specifically the mandatory buffer between the final loan disclosure and the signing date.
What the research doesn’t establish is the total number of days from an accepted offer to closing. That timeline varies by lender, loan type, property condition, appraisal scheduling, title search, and local market norms. The three-business-day Closing Disclosure requirement is a minimum federal rule — not a total closing timeline.
The Ability-to-Repay requirement also applies here. Under 15 U.S.C. §1639c, lenders must make a reasonable, good-faith determination that a borrower can repay a covered mortgage loan before consummation. This affects which borrowers qualify for which loan amounts — and at what rate — before any offer is even made.
Buyer’s Market vs. Seller’s Market: What This Research Can Establish
Conventional real estate guidance treats inventory above 6 months as a buyer’s market and below 3 months as a seller’s market. July 2026’s 4.6 months sits between those thresholds — often described as balanced.
But the supplied research doesn’t establish a formal federal definition for either term. And more importantly, the NAR July data itself shows why simple market-type labels don’t capture what’s actually happening.
| Market Signal | July 2026 Reading | Direction |
|---|---|---|
| Monthly sales change (vs. June) | –1.7% | ↓ Softening demand |
| Annual sales change (vs. July 2025) | +0.7% | ↑ Year-on-year growth |
| Median price change (vs. July 2025) | +2.0% | ↑ Prices still rising |
| Months of supply | 4.6 months | → Between buyer/seller thresholds |
| Inventory change (vs. June) | –1.9% | ↓ Less supply than prior month |
| Consecutive YoY price gains | 37 months | ↑ Long-running price trend |
The table shows the problem with simple market labels. July’s signals don’t point in one direction. Monthly sales fell — but annual sales rose. Inventory sits in the middle zone — but prices still increased 2.0% year over year. Calling fall 2026 simply a “buyer’s market” or “seller’s market” without local evidence goes well beyond what this research supports.
What the Data Shows Works (and What Doesn’t)
What the NAR, IRS, and federal regulation data consistently supports
Benchmarking against actual July data rather than seasonal assumptions.
The $434,100 median price, 4.6 months of inventory, and 37 consecutive months of YoY gains are the most current national reference points available. Building a buying decision on those figures — adjusted for local conditions — is more defensible than building it on an expectation of fall price drops that the data doesn’t support.
Calculating household-level mortgage costs before evaluating market timing.
The national median and a 6.71% rate produce ~$2,243/month in P&I — but that figure changes with every $10,000 in down payment and every 0.25% in rate. Running your specific scenario through the Mortgage Calculator gives a more accurate picture of affordability than any national average.
Checking local inventory rather than relying on the national figure.
The NAR’s 4.6 months of supply is a national average. Specific metropolitan areas — and specific neighborhoods within them — may show significantly different inventory levels. Local MLS data and a real estate professional with knowledge of the specific market give more actionable information than the national figure alone.
Treating the Ability-to-Repay requirement as a floor, not a target.
Federal law requires lenders to make a good-faith determination that borrowers can repay. A loan that meets the ATR standard isn’t necessarily comfortable for the household’s actual budget — particularly when property taxes, insurance, and maintenance are added to the P&I payment.
What the data doesn’t support
Assuming fall automatically brings lower national home prices.
Thirty-seven consecutive months of year-over-year price gains through July 2026 is the clearest counter-evidence. July’s 1.7% monthly sales decline didn’t produce a price decline. The research doesn’t show an autumn price reduction pattern in the data available.
Treating July national figures as predictive of September–November conditions.
The data limitation is genuine. As of September 8, 2026, the NAR’s published data covers July. October and November are not established by the research.
Assuming the mortgage interest deduction applies universally.
The IRS reminder published May 21, 2026 was educational — not a confirmation that every homeowner receives a deduction. Deductibility depends on specific circumstances, including itemization status and applicable limits.

Realistic Expectations for a Fall 2026 Home Buyer
The research supports a clear framing: fall 2026 buyers should expect to navigate a market where the most recent national data is mixed, price growth has been sustained for more than three years, and mortgage rates remain elevated relative to the pre-2022 environment.
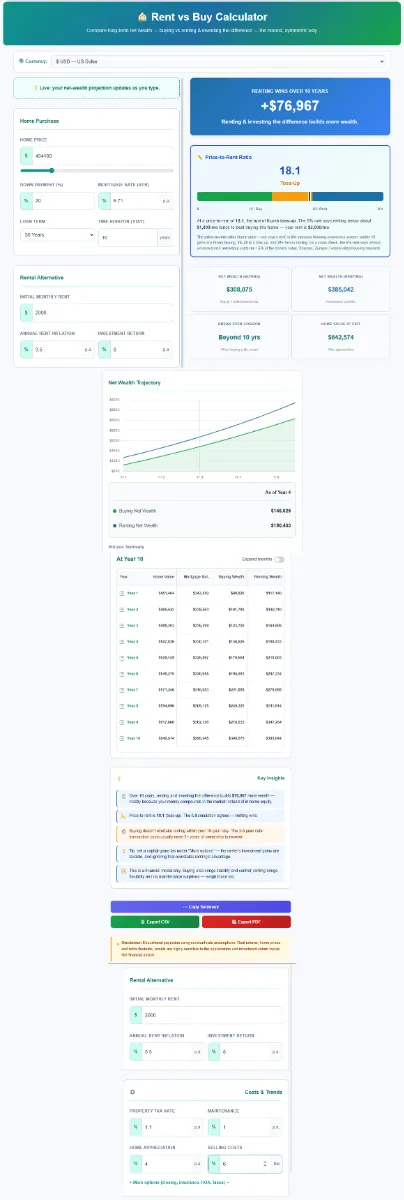
The $434,100 July median at 6.71% produces a P&I payment that sits well above what many households can comfortably absorb. But the national median isn’t every buyer’s price. Gen Z buyers in lower-cost markets face different math than Gen X buyers in coastal metros. The Rent vs. Buy Calculator makes the comparison between continuing to rent and purchasing at current rates concrete — based on your local market’s actual numbers, not the national median.
The most intellectually honest statement the research supports is this: there isn’t enough national evidence yet to say fall 2026 is broadly a better or worse buying season than other times of year. The July data shows a mixed market. The fall data hasn’t been published. The buyers best positioned to make good decisions in this environment are those who know their local inventory, have run their household-level mortgage math, and have verified their eligibility under the ATR standard before making an offer.
Bottom Line: 5 Steps for Fall 2026 Home Buyers
1. Benchmark against the July 2026 data — and acknowledge what it can’t tell you:
The NAR’s most current data shows a $434,100 median price, 4.6 months of supply, and 37 consecutive months of YoY price gains. September–November national data hasn’t been published. Use the July figures as your reference point for modeling, not as a confirmation of fall conditions — because the fall data doesn’t exist yet.
2. Run your household-level mortgage scenario before evaluating market timing:
The Mortgage Calculator converts the national median and the September 3 rate (6.71%) into a ~$2,243/month P&I payment on a 20% down, 30-year loan. Your price, down payment, credit score, and lender’s rate offer will produce a different number. That number — compared to your income and other obligations — is what the ATR standard, and your own budget, both require you to answer honestly.
3. Check your local market’s inventory — not the national figure:
NAR’s 4.6 months of national supply masks enormous local variation. A suburb with 2 months of inventory behaves like a seller’s market regardless of what the national number says. A market with 7 months of supply gives buyers more time and negotiating room. Find the local figure from your area’s MLS or a knowledgeable real estate professional before drawing conclusions from the national data.
4. Verify Ability-to-Repay before making any offer:
Regulation Z requires lenders to make a good-faith determination that borrowers can repay. That means lenders will assess income, assets, employment, debts, and credit history. Understanding where you stand on those factors before making an offer avoids the scenario of negotiating on a home that the ATR standard will later prevent you from financing.
5. Don’t budget for fall price drops that 37 months of data suggest aren’t coming nationally:
The most common seasonal home-buying assumption is that prices soften in fall and winter. July’s data shows the 37th consecutive month of year-over-year price gains. A buyer whose plan depends on a national price decline should recalibrate to the current benchmark — $434,100 — rather than waiting for a decline the research doesn’t support.
“When I went through the July NAR release and cross-referenced it with the Freddie Mac rate data, what stood out wasn’t a price decline — it was a contradiction. The July median price rose 2.0% year over year while sales fell 1.7% from June. That’s two signals pointing in different directions at once. It tells me the data doesn’t support a simple ‘fall is better’ or ‘fall is worse’ verdict. It supports doing your own local homework.”
— Kevin Brown, Lead Researcher at SaveXpert.com
Frequently Asked Questions
Ans: Based on the most current available data — the NAR’s July 2026 existing-home sales report — the research can’t establish a universal yes or no for fall conditions. July showed a $434,100 median price (+2.0% YoY), 4.6 months of supply, and 37 consecutive months of year-over-year price gains. September, October, and November figures haven’t been published yet. The research supports evaluating local inventory and household-level mortgage costs rather than assuming seasonal discounts will materialize nationally.
Ans: The NAR data through July 2026 doesn’t support a universal yes. The July report marked 37 consecutive months of year-over-year existing-home price gains — reaching $434,100 versus $425,700 a year earlier. Monthly sales fell 1.7% from June, but that monthly decline didn’t produce a year-over-year price drop. The research doesn’t contain enough fall-specific data to establish whether prices will fall during October and November 2026. Historical patterns vary by local market and economic condition.
Ans: The research brief reports a 6.71% average 30-year fixed mortgage rate for the week ending September 3, 2026, based on Freddie Mac data as quoted by Reuters. The research flags this figure because it comes from a secondary source rather than a primary government publication — verify it directly against the Freddie Mac Primary Mortgage Market Survey before using it in any financial calculation. The research brief doesn’t provide a verified earlier-2026 series for direct comparison.
Ans: The NAR data through July 2026 doesn’t establish national advantages specific to October or November. Individual buyers may find localized opportunities — such as reduced competition as the school-year buying rush subsides, or sellers more motivated to close before year-end. But the supplied national research doesn’t support guaranteeing better inventory levels, lower prices, or reduced competition based solely on a late-fall purchase date. Local market conditions vary significantly from national figures.
Ans: The research establishes one specific federal rule on closing timing: under Regulation Z, lenders must ensure the buyer receives the Closing Disclosure at least three business days before consummation for most covered closed-end residential mortgages. The total time from an accepted offer to closing isn’t established by the research — it varies by lender, loan type, appraisal scheduling, title search, and local norms. The three-business-day Closing Disclosure rule is a minimum federal requirement, not a total closing timeline.
Ans: Conventional real estate guidance places buyer’s markets above 6 months of supply and seller’s markets below 3 months. July 2026’s 4.6 months sits between those thresholds — often described as balanced. But the July NAR data shows that the 4.6-month inventory level didn’t produce price declines: the median price still rose 2.0% year over year. That level gives buyers more options than the sub-3-month inventory environment seen during the pandemic years, but the research doesn’t support assuming 4.6 months of supply automatically delivers lower prices or better negotiating conditions.